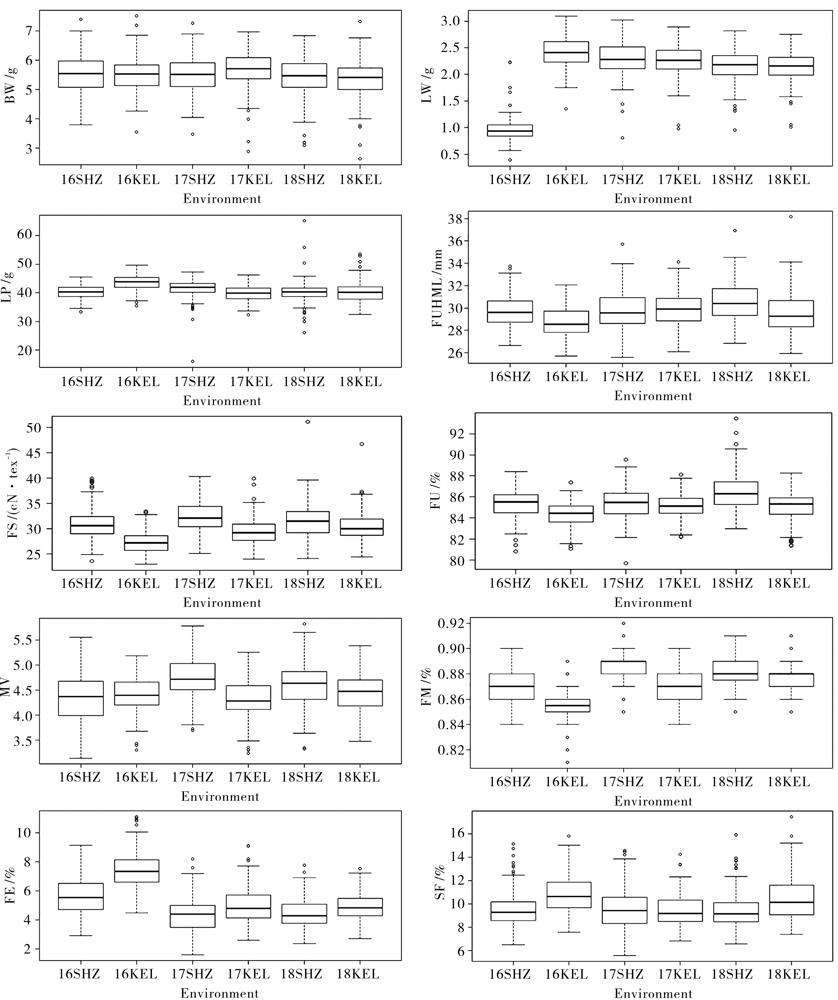
Fig. 1 Boxplot diagram of 10 traits in Shihezi and Korla regions from 2016 to 2018 The ends of boxplot, the circles out of both ends of boxplot, and the bold lines in the middle show the extreme range, single the maximum and minimum value, and the mean of phenotypic value of the targeted trait, respectively.
Other figure/table from this article