

 , 陈静, 李亚兵
, Chen Jing, Li Yabing
, 陈静, 李亚兵
, Chen Jing, Li Yabing
基于农业碳足迹理论及生命周期评价法,采用问卷调查方式,定量研究河北省棉花生产碳足迹,分析其构成因素,解析河北省棉花生产肥料和灌溉投入与产量的关系。研究结果表明:1)河北省棉花生产单位面积、单位产量、单位生物量、单位产值碳足迹(以CO2当量计)分别为3272.71 kg·hm-2, 1.04 kg·kg-1, 0.40 kg·kg-1和 0.34 kg·¥-1,低于前人研究结果中华北平原作物生产平均碳足迹和冬小麦碳足迹;2)化肥、灌溉、地膜为河北省棉花生产碳排放主要来源,分别占棉花生产碳足迹的34.53%、25.98%和18.44%;3)在调研的棉田中,25.63%的地块肥料投入过量,21.11%的地块灌溉投入过量,且产量较低,存在着较大的节能减排潜力。逐步扩大棉花种植面积,并发展棉花节肥、节水、免覆膜技术,必将成为未来河北省作物生产应对气候变化,发展低碳农业的重要举措。
Based on farmer's production survey data from Hebei Province, the carbon footprint of cotton production in Hebei Province was estimated using a life-cycle assessment method in the agricultural sector. The proportions of different agricultural inputs in the carbon footprint of cotton production was explored. In addition, the relationships between fertilizer and irrigation inputs and the cotton yield output was analyzed. The results were as follows: 1) the carbon footprint per unit sown area, carbon footprint per unit yield, carbon footprint per unit biomass and carbon footprint per unit production value for cotton production in Hebei Province were 3272.71 kg·hm-2, 1.04 kg·kg-1, 0.40 kg·kg-1 and 0.34 kg·¥-1, respectively. The carbon footprint of cotton production was lower than that of winter wheat; 2) the main components of the carbon footprint were fertilizer(34.53%), electricity for irrigation (25.98%) and plastic film (18.44%); and 3) in this study, 25.63% of a field exposed to excessive fertilizer and 21.11% of a field exposed to excessive irrigation showed low yields. Thus, there were large energy savings and emission reduction potentials. Gradually expanding the cotton planting area and developing technology that limits water and fertilizer consumption, as well as eliminating plastic film during mulching, could help to mitigate greenhouse gas emissions from agricultural production of Hebei Province.
气候变化是当今人类面临的最严峻的全球环境问题之一。气候变化的主要原因是由于人类活动向大气中排放过量的二氧化碳(CO2)、甲烷(CH4)和氧化亚氮(N2O)等温室气体[1-2]。2014年APEC会议上,中美双方共同发表了《中美气候变化联合声明》,中方承诺2030年温室气体排放达到峰值且将努力早日达峰,因此中国减少温室气体排放的压力巨大。联合国政府间气候变化专门委员会(Intergovernmental Panel on Climate Change,IPCC)第五次评估报告表明,农业源温室气体排放占全球温室气体排放总量的24%,其中CH4和N2O排放分别占全球总的CH4和N2O排放量的70%和90%[3]。因此,在保证作物产量水平的基础上,研究作物生产碳排放及减排策略,是减缓全球气候变化的现实需求,也是我国保持农业可持续发展的战略选择。
近年来,碳足迹作为一个新的研究方法,成为气候变化背景下低碳减排领域的研究热点[4-5]。关于碳足迹的定义以及计算边界,研究中存在许多争议,但经过逐步发展,碳足迹的定义逐渐明晰,即:一项活动、一个产品(或服务)的整个生命周期或者某一地理范围内直接和间接产生的温室气体总量[6-7]。其中,温室气体最终以全球变暖潜能值折合成CO2当量(CO2 eq)[8-9]。农业领域碳足迹研究尚处于起步阶段,一些学者定量研究作物生产碳足迹,从而提出农业可持续发展策略,Nelson 等测算了美国农业的碳足迹[10],Dubey和Lal[11]研究了美国俄亥俄州和印度旁遮普邦的农业碳足迹,Gan等[12-15]研究了小麦、油菜等作物的碳足迹,并探讨了降低碳足迹的栽培耕作措施。Cheng[16]等分析了1993—2007年中国作物生产的平均碳足迹的动态及构成,陈阜等[17-22]利用统计数据分析了1993—2012年华北平原作物生产碳足迹的时空动态分布及其构成,并分析了冬小麦、夏玉米的碳足迹及其构成,研究了不同农作措施对冬小麦、夏玉米碳足迹的影响。目前国内关于粮食作物生产碳足迹及其减排策略的研究方兴未艾,但棉花碳足迹及其低碳减排策略的研究,鲜见报道。
棉花是河北省最主要的经济农作物,2005—2014年河北省棉花平均播种面积超过59万hm-2,约占全国棉花播种面积的11.68%[23]。近年来,由于化肥、灌溉等投入的增加,河北省棉花单产也呈连续增长趋势,但投入的增加不可避免的带来温室气体排放的增加。因此,研究河北省棉花生产碳足迹及其构成,将会填补目前我国作物生产碳足迹研究的空白,并对于我国农业低碳可持续发展,有着重要意义。本研究基于调研数据,利用农业碳足迹理论及生命周期评价法,定量分析了河北省棉花生产碳足迹及其构成,以及河北省棉花生产低碳策略与潜力,以期为农业节能减排提供理论支撑与科学依据。
本文数据来源于2014—2015年实地农户生产调查。在河北省邯郸市、邢台市、沧州市棉花主产区选取12个县市,每个县选取2个乡镇,每个乡镇选取2~3个村,每个村选取几户植棉农户(包括农业技术人员、植棉大户和普通植棉农户)。共获取有效问卷103份。调查内容包括:棉花播种面积、棉花播种量、化肥种类和用量、灌溉用电量、农药种类和用量、地膜用量、机械柴油用量、人工投入量、子棉产量、子棉价格等。
1.2.1 作物生产碳排放。作物生产碳排放指从播种到收获整个生产过程中的灌溉用电、化肥、农药、农用塑料膜、农用柴油等投入品的生产、运输、使用过程中的温室气体排放以及农田土壤N2O直接排放的总和。系统边界如
GHGemissions=AIi×EFi+GHG (1)
GHG=FN×δN××298 (2)
其中GHG emissions为作物生产碳排放总量,n表示农业生产过程中的投入(化肥、灌溉耗电、农药、种子、农用塑料膜等)的种类,AIi表示第i种投入,EFi表示第i种投入的排放参数,排放参数主要源于中国生命周期数据库(CLCD)和Ecoinvent数据库(
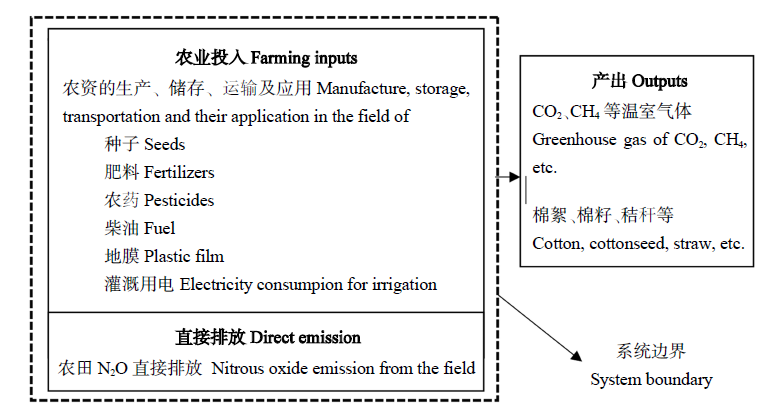
图1 棉花生产碳足迹计算边界
Fig. 1 System boundary for calculating carbon footprint in cotton production system
表1 不同投入品的碳排放参数
Table 1 Index of GHG emission of different inputs for agricultural production
CFs =GHG emissions / TA (3)
CFy =GHG emissions / TY (4)
CFb =GHG emissions / TB (5)
CFv =GHG emissions / TV (6)
1.2.2 碳足迹。CFs为单位播种面积的作物生产碳足迹,CFy为单位产量的作物生产碳足迹,CFb为单位生物产量碳足迹,CFv为单位产值的作物生产碳足迹[28]。
式中TA指播种面积,TY指作物产量,TB指作物生物产量,TV指作物产值。
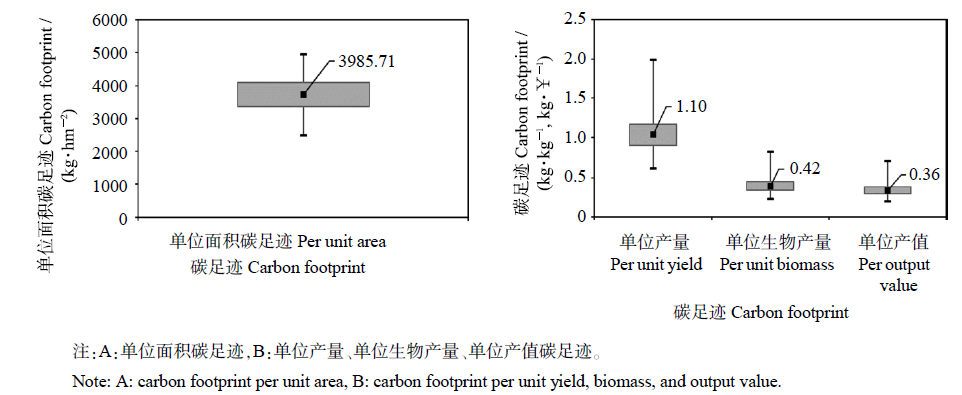
河北省棉花生产碳足迹如
河北省棉花生产碳足迹构成如
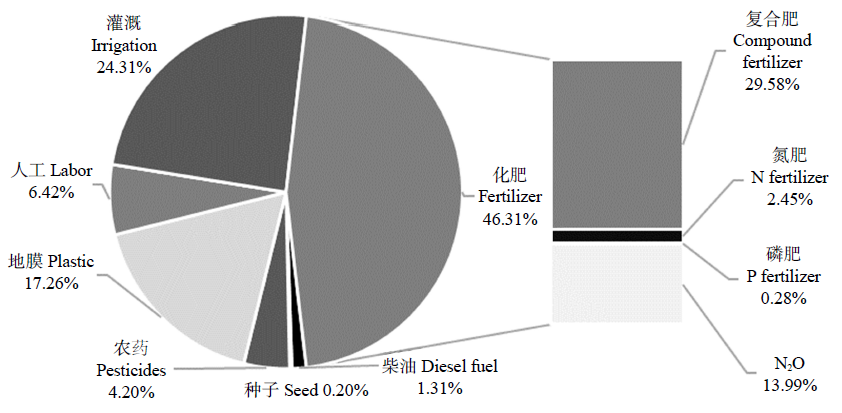
图3 河北省棉花生产碳足迹构成
Fig. 3 Contribution of different inputs to total carbon footprint of cotton production in
Hebei province
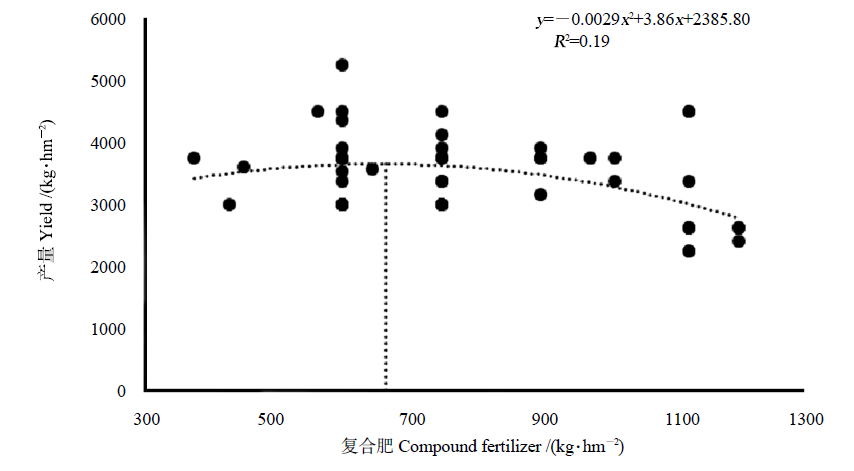
河北省棉花生产复合肥实物投入量与产量的关系如
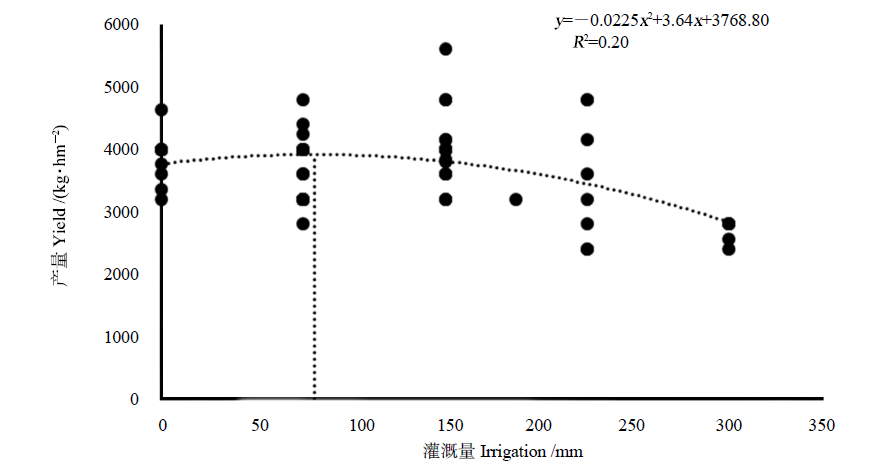
河北省棉花生产灌溉量与产量的关系如
作物生产碳足迹受种植制度、农作措施以及社会经济等多方面影响,并且各因素存在互作,因此不同作物的碳足迹存在显著差异[21]。Cheng等计算我国作物生产单位面积碳足迹平均值为2860 kg·hm-2,单位产量碳足迹平均值为0.11 kg·kg-1 [16];王占彪等利用统计数据计算华北平原作物生产单位面积、单位产量、单位产值碳足迹平均值分别为4400 kg·hm-2、7120 kg·hm-2、0.45 kg·kg-1、3.58 kg·¥-1[17-19];卢小宏等基于田间试验,研究得出河北吴桥冬小麦单位面积碳足迹为4554.87 kg·hm-2,单位产量碳足迹为0.58 kg·kg-1;夏玉米单位面积碳足迹为3026.80 kg·hm-2,单位产量碳足迹为0.29 kg·kg-1 [20]。本研究得出河北省棉花生产单位播种面积碳足迹、单位产量碳足迹、单位产值碳足迹分别为3985.71 kg·hm-2, 1.10 kg·kg-1, 0.36 kg·¥-1。因此,单位面积碳足迹表现为:华北平原作物生产平均值>冬小麦>棉花(≈夏玉米)>全国作物生产平均值。说明华北平原作物生产投入较高,高于全国平均值。而华北平原作物生产中,冬小麦单位面积碳足迹较大,棉花与夏玉米单位面积碳足迹较小。因此在未来华北平原作物生产布局中,应适当压缩冬小麦面积,扩大棉花种植面积,来减少农业温室气体排放。
前人研究表明,肥料与灌溉是农田温室气体排放的主要来源[17-20]。本研究以棉花为研究对象得出类似结果,其中化肥的生产、运输及使用占32.31%,氮肥投入所引起的农田N2O直接排放占13.99%,灌溉消耗用电占碳足迹比例为24.31%。河北省棉花生产中,地膜投入所引起的温室气体排放也较大,占总排放的17.26%。因此未来河北省棉花生产低碳减排重点应放在肥料与水分的高效利用,以及减少或免去地膜覆盖所引起的温室气体排放上。
本研究发现,河北省棉花生产有25.63%的地块肥料投入过量,21.11%的地块灌溉投入过量,产量均较低。说明当前河北省棉花生产中存在施肥过量、灌溉过量的现象。因此,河北省部分肥料与灌溉投入过高的棉田,应该在稳定棉花产量水平的基础上,适当减少肥料与灌溉投入,增加肥水利用效率,减少温室气体排放。
河北省棉花生产的低碳策略应优先考虑减少肥料、灌溉、地膜以及农田N2O直接排放上。通过采用配方施肥、缓控释肥等技术,来提高肥料利用效率,减少肥料使用与排放;大力发展节水农业,研发农田新型高效节水灌溉技术,改善灌溉系统和灌溉技术,采用先进的滴灌、喷灌、渗灌、微灌等技术、水肥一体化等技术,来提高水分利用效率,减少灌溉消耗用电所造成的温室气体排放;通过采用晚春播等技术,免去地膜覆盖,减少地膜生产、运输过程中的温室气体排放;通过采用免耕技术,使用缓控释肥或硝化抑制剂等技术来降低农田N2O直接排放。这些节肥、节水、免覆膜和减少农田N2O排放等技术必将成为未来河北省棉花生产应对气候变化,发展低碳农业的重要举措。
由于调研范围和样本量的局限性,本研究中采用的肥料数据均为实物数据,灌溉数据为灌溉次数数据,每次灌溉量估算为75 mm,这些将对研究结果造成一定的影响。此外,本研究所采用的生命周期评价法,系统边界存在一定争议,如碳足迹计算时是否考虑机械损耗、土壤碳变化等[29-32]。由于中国生命周期数据库中部分参数的缺失,在计算碳足迹时部分参数采用国外参数,对结果有一定的影响。以上不足有待进一步完善。
致谢:
感谢河北省农业厅经作处、河北省农科院信息所、沧州农科院棉花所、邢台农科院棉花所、高阳硕丰农场、威县农业试验站、成安县农业实验站、中国农业大学吴桥试验站、河北众信种业科技有限公司以及河北农业大学棉花栽培实验室的各位同仁在数据获得方面给予的支持与帮助!
The authors have declared that no competing interests exist.
| [1] |
[本文引用:1]
|
| [2] |
农业是重要的温室气体排放源。该文通过对文献资料和大量研究结果进行分析,得出中国农业活动产生的甲烷和氧化亚氮分别占全国甲烷和氧化亚氮排放量的50.15%和92.47%,农业源占全国温室气体排放总量的17%;通过改善反刍动物营养可降低单个肉牛甲烷排放15%~30%;推广稻田间歇灌溉可减少单位面积稻田甲烷排放30%;一个户用沼气每年最大可减少温室气体2.0~4.1 t二氧化碳当量;推行缓释肥、长效肥料可减少单位面积农田氧化亚氮50%~70%。该文建议尽快开展减排技术示范,对减排技术的适应性和经济性进行评价。
Magsci
[本文引用:1]
|
| [3] |
[本文引用:1]
|
| [4] |
由温室气体引起的全球变暖问题已引起国际社会的普遍关注,随着全球变暖成为社会关注的热点,碳足迹成为一个新的研究方法并迅速得到学术界的认可.本文从碳足迹的起源和各种定义入手,系统阐述了碳足迹的概念,并从不同角度探讨了碳足迹的各种分类.本文重点介绍了碳足迹的计算方法,主要包括投入产出分析方法、生命周期评价法、IPCC计算方法和碳足迹计算器等四大类,并总结和比较了四种方法的优缺点.在此基础上,对国内外相关研究系统地进行了归纳和总结,客观分析和评价了当前碳足迹的研究现状和存在的问题.本文还介绍了目前国际上四个主要的碳足迹评估标准:英国的PAS 2050:2008标准、世界可持续发展商业协会和世界资源研究院共同发起制定的GHG议定书、日本的标准仕样书TS Q 0010标准和ISO 14067标准,并以GHG议定书和PAS 2050两个标准为例分析了进行碳足迹评估的重要前提--边界界定问题.最后对碳足迹研究的重点领域和发展方向进行了展望.
|
| [5] |
采用1990-2009年农作物产量、农田生产投入等统计数据, 对中国农田生态系统碳排放、碳吸收和碳足迹进行估算,得到以下主要结论:碳排放量和碳排放强度、碳吸收量、碳足迹呈现增加趋势,碳吸收强度表现稳定,随着 农用化石能源的大量使用,单位面积碳足迹从1990年的0.08hm2/hm2增加到2009年的0.13hm2/hm2。各省(市、自治区)单位面积碳 足迹差异十分明显,2009年最高的福建为0.27hm2/hm2,最低的黑龙江为0.08hm2/hm2。中国农田生态系统存在碳生态盈余,碳足迹占同 期生产性土地面积(耕地)的比例在10%左右,但随着年份的递进,所占比例有增大的趋势,1990年为8.46%,2009年为12.75%。
URL
[本文引用:1]
|
| [6] |
Nature is the international weekly journal of science: a magazine style journal that publishes full-length research papers in all disciplines of science, as well as News and Views, reviews, news, features, commentaries, web focuses and more, covering all branches of science and how science impacts upon all aspects of society and life.
|
| [7] |
[本文引用:1]
|
| [8] |
Carbon footprints and embodied carbon have a strong methodological foundation and provide valuable input into policy formation. The widespread use of carbon footprints using existing knowledge needs to be encouraged and even regulated. At the product level, carbon footprints can empower consumers to shape their own climate friendly behaviour and help governments design policies that do not give the wrong incentives. Companies can use carbon footprints to reduce exposure to carbon prices or highlight the positive actions they have taken. Cities and regions can use carbon footprints to implement local policies that help meet overarching national objectives. National carbon footprints can help design equitable and efficient climate agreements that avoid shifting problems to other administrative territories. Further advances can provide strong interdisciplinary links between the physical carbon-cycle, emission drivers, and policy at a variety of scales.
|
| [9] |
In recent years, attempts have been made to develop an integrated Footprint approach for the assessment of the environmental impacts of production and consumption. In this paper, we provide for the first time a definition of the "Footprint Family" as a suite of indicators to track human pressure on the planet and under different angles. This work has been developed under the 7th Framework Programme in the European Commission (EC) funded One Planet Economy Network: Europe (OPEN:EU) project. It builds on the premise that no single indicator per se is able to comprehensively monitor human impact on the environment, but indicators rather need to be used and interpreted jointly. A description of the research question, rationale and methodology of the Ecological, Carbon and Water Footprint is first provided. Similarities and differences among the three indicators are then highlighted to show how these indicators overlap, interact, and complement each other. The paper concludes by defining the "Footprint Family" of indicators and outlining its appropriate policy use for the European Union (EU). We believe this paper can be of high interest for both policy makers and researchers in the field of ecological indicators, as it brings clarity on most of the misconceptions and misunderstanding around Footprint indicators, their accounting frameworks, messages, and range of application. (C) 2011 Elsevier Ltd. All rights reserved.
|
| [10] |
[本文引用:1]
|
| [11] |
Sustainability of agricultural systems depends on their carbon (C) footprint, and the Coutput:Cinput ratio. Thus, this study was conducted with the objectives to: (i) assess the agricultural C emissions in relation to predominant farming systems in Punjab, India, and Ohio, USA; (ii) evaluate C-use efficiency of production systems; and (iii) determine the relative sustainability of agronomic production systems as determined by their C footprints. The data collated on C-based input into the soil for predominant crops for both regions included the amounts of fertilizers (N, P, K), herbicides and pesticides used for each crop annually, tillage methods, cropland area, total production of each crop, area under different farming systems, water-management practices (e.g., tubewell irrigation), and total number of livestock. These data were used to compute C equivalent (CE) per hectare of input and output, and the relative sustainability indices as a measure of the C-production efficiency. There existed a linear r...
|
| [12] |
The Earth's climate is rapidly changing largely due to increasing anthropogenic greenhouse gas (GHG) emissions. Agricultural practices during crop production, food processing, and product marketing all generate GHG, contributing to the global climate change. The general public and farmers are urging the development and adoption of effective measures to reduce GHG emissions from all agricultural activities and sectors. However, quantitative information is not available in regard to what strategies and practices should be adopted to reduce emission from agriculture and how crop productivity would affect the intensity of GHG emission. To provide the potential solution, we estimated the carbon footprint [i.e., the total amount of GHG associated with the production and distribution of a given food product expressed in carbon dioxide equivalence (CO(2)e)] for some of the major field crops grown on the Canadian prairie and assessed the effect of crop sequences on the carbon footprint of durum wheat. Key strategies for reducing the carbon footprint of various field crops grown in semiarid areas were identified. Carbon footprints were estimated using emissions from (1) the decomposition of crop straw and roots; (2) the manufacture of N and P fertilizers and their rates of application; (3) the production of herbicides and fungicides; and (4) miscellaneous farm field operations. Production and application of N fertilizers accounted for 57% to 65% of the total footprint, those from crop residue decomposition 16% to 30%, and the remaining portion of the footprint included CO(2)e from the production of P fertilizer and pesticides, and from miscellaneous field operations. Crops grown in the Brown soil zone had the lowest carbon footprint, averaging 0.46 kg CO(2)e kg(-1) of grain, whereas crops grown in the Black soil zone had a larger average carbon footprint of 0.83 kg CO(2)e kg(-1) of grain. The average carbon footprint for crops grown in the Dark Brown soil zone was intermediate to the other two at 0.61 kg CO(2)e kg(-1) of grain. One kilogram of grain product emitted 0.80 kg CO(2)e for canola (Brassica napus L.), 0.59 for mustard (Brassica juncea L.) and flaxseed (Linum usitatissimum L.), 0.46 for spring wheat (Triticum aestivum L.), and 0.20 to 0.33 kg CO(2)e for chickpea (Cicer arietinum L.), dry pea (Pisum sativum L.), and lentil (Lens culinaris Medik.). Durum wheat (T. aestivum L.) preceded by an N-fixing crop (i.e., pulses) emitted total greenhouse gases of 673 kg CO(2)e, 20% lower than when the crop was preceded by a cereal crop. Similarly, durum wheat preceded by an oilseed emitted 744 kg CO(2)e, 11% lower than when preceded by a cereal. The carbon footprint for durum grown after a pulse was 0.25 kg CO(2)e per kg of the grain and 0.28 kg CO(2)e per kg of the grain when grown after an oilseed: a reduction in the carbon footprint of 24% to 32% than when grown after a cereal. The average carbon footprint can be lowered by as much as 24% for crops grown in the Black, 28% in the Dark Brown, and 37% in the Brown soil zones, through improved agronomic practices, increased N use efficiency, use of diversified cropping systems, adoption of crop cultivars with high harvest index, and the use of soil bioresources such as P-solublizers and arbuscular mycorrhizal fungi in crop production.
|
| [13] |
Best agricultural practices can be adopted to increase crop productivity and lower carbon footprint of grain products. The aims of this study were to provide a quantitative estimate of the carbon footprint of selected oilseed crops grown on the semiarid northern Great Plains and to determine the effects of N fertilization and environments on the carbon footprint.<br/>Five oilseed crops, Brassica napus canola, Brassica rapa canola, Brassica juncea canola, B. juncea mustard, and Sinapis alba mustard, were grown under the N rates of 0, 25, 50, 100, 150, 200, and 250 kg N ha(-1) at eight environsites (location x year combinations) in Saskatchewan, Canada. Straw and root decomposition and various production inputs were used to calculate greenhouse gas emissions and carbon footprints.<br/>Emissions from the production, transportation, storage, and delivery of N fertilizer to farm gates accounted for 42% of the total greenhouse gas emissions, and the direct and indirect emission from the application of N fertilizer in oilseed production added another 31% to the total emission. Emissions from N fertilization were nine times the emission from the use of pesticides and 11 times that of farming operations. Straw and root decomposition emitted 120 kg CO(2)eq ha(-1), contributing 10% to the total emission. Carbon footprint increased slightly as N rates increased from 0 to 50 kg N ha(-1), but as N rates increased from 50 to 250 kg N ha(-1), carbon footprint increased substantially for all five oilseed crops evaluated. Oilseeds grown at the humid Melfort site emitted 1,355 kg CO(2)eq ha(-1), 30% greater than emissions at the drier sites of Scott and Swift Current. Oilseeds grown at Melfort had their carbon footprint of 0.52 kg CO(2)eq kg(-1) of oilseed, 45% greater than that at Scott (0.45 kg CO(2)eq kg(-1) of oilseed), and 25% greater than that at Swift Current (0.45 kg CO(2)eq kg(-1) of oilseed).<br/>Carbon footprint of oilseeds was a function of the rate of N fertilizer, and the intensity of the functionality varied between environments. Key to lower carbon footprint in oilseeds is to improve N management practices.
|
| [14] |
Carbon footprint of field crops can be lowered through improved cropping practices. The objective of this study was to determine the carbon footprint of spring barley ( L.) in relation to various preceding oilseed crops that were fertilized at various rates of inorganic N the previous years. System boundary was from cradle-to-farm gate.<br/>Canola-quality mustard ( L.), canola ( L.), sunflower ( L.), and flax ( L.) were grown under the N fertilizer rates of 10, 30, 70, 90, 110, 150, and 200 kg N ha(-1) the previous year, and spring barley was grown on the field of standing oilseed stubble the following year. The study was conducted at six environmental sites; they were at Indian Head in 2005, 2006 and 2007, and at Swift Current in 2004, 2005 and 2006, Saskatchewan, Canada.<br/>On average, barley grown at humid Indian Head emitted greenhouse gases (GHGs) of 1,003 kg CO(2)eq ha(-1), or 53% greater than that at the drier Swift Current site. Production and delivery of fertilizer N to farm gate accounted for 26% of the total GHG emissions, followed by direct and indirect emissions of 28% due to the application of N fertilizers to barley crop. Emissions due to N fertilization were 26.6 times the emission from the use of phosphorous, 5.2 times the emission from pesticides, and 4.2 times the emission from various farming operations. Decomposition of crop residues contributed emissions of 173 kg CO(2)eq ha(-1), or 19% of the total emission. Indian Head-produced barley had significantly greater grain yield, resulting in about 11% lower carbon footprint than Swift Current-produced barley (0.28 vs. 0.32 kg CO(2)eq kg(-1) of grain). Emissions in the barley production was a linear function of the rate of fertilizer N applied to the previous oilseed crops due to increased emissions from crop residue decomposition coupled with higher residual soil mineral N.<br/>The key to lower the carbon footprint of barley is to increase grain yield, make a wise choice of crop types, reduce N inputs to crops grown in the previous and current growing seasons, and improved N use efficiency.
|
| [15] |
Improving cropping systems may help mitigate greenhouse gas emissions. This study determined the carbon footprint of durum wheat (Triticum turgidum L.) produced in diverse cropping systems. Durum was grown in rotation systems which had different combinations of oilseed, pulse, and cereal crops at five site-years in Saskatchewan, Canada. Total greenhouse gas emissions from the decomposition of crop residues along with various production inputs were used for the estimation of carbon footprint. On average, emissions from the decomposition of crop straw and roots accounted for 25% of the total emissions, those from the production, transportation, storage, and delivery of fertilizers and pesticides to farm gates and their applications 43%, and emissions from farming operations 32%. Durum wheat preceded by an oilseed crop (Brassica napus or Brassica juncea) the previous year had carbon footprint of 0.33 kg CO(2)e kg(-1) of grain, or 7% lower than durum in cereal-cereal-durum system. Durum preceded by a biological N-fixing crop (Cicer arietinum chickpea, Lens culinaris lentil, or Pisum sativum pea) the previous year lowered its carbon footprint by 17% compared with durum preceded by a cereal crop. Durum produced in a pulse-pulse-durum system had carbon footprint 0.27 kg CO(2)e kg(-1) of grain, 34% lower than durum grown in cereal-cereal-durum systems. Diversifying cropping systems with oilseeds and biological N-fixers significantly lowered carbon footprint of durum wheat. Crown Copyright (C) 2011 Published by Elsevier B.V. All rights reserved.
|
| [16] |
Characterizing the footprint (CF) of agricultural production offers key information for pursuing low agriculture and food consumption. While China has long strived for increasing food production capacity for its large and still growing population, the high emissions cost, especially from the over use of agro-chemicals, has been widely debated for the last decade. However, the CF of China's crop production has not yet been assessed. This paper reports a basic estimate of CF of crop production using national statistical data available for the period of 1993–2007. The dataset includes the amount of individual agricultural inputs (fertilizer, pesticide, diesel, plastic film, etc.), cultivation area and total of production whole crops. Using the emission factors estimated for China's agricultural features and available abroad, the mean overall CF of China's crop production was estimated to be 0.78±0.08tCEha611yr611 and 0.11±0.01tCEt611yr611, for land use and bulk production respectively. For the duration the data covered, the intensity under cultivation land use was seen to increase since 1993. Among the total, fertilizer induced emissions exerted the largest contribution of 6560%, being 0.45±0.04tCE per ha and 0.07±0.01tCE per ton of production, on average. Compared to the UK, the estimated overall CF of China's crop production was higher in terms of cultivation land use. While there was a significant positive correlation of intensity with total production, efficiency was shown in a decreasing trend during 2003-2007. Therefore, low agriculture should be pursued, and the priority should be given to reducing fertilizer application in agriculture of China. However, for developing best management practices for climate change mitigation in crop production of China, further studies of crop and regional specific CFs and the variation with climate conditions and agricultural managements are needed.
|
| [17] |
【目的】分析华北平原作物生产碳足迹的动态、分布以及构成,为发展低碳农业提供理论支撑与科学依据。【方法】基于中国华北平原河北、北京、天津、山东、河南5个代表省(市)的47个市的耕地面积、农作物播种面积、产量、产值及作物生产投入等统计数据,利用农业领域碳足迹理论及生命周期评价法,估算作物生产的单位播种面积碳足迹(CFs)、单位耕地面积碳足迹(CFc)、单位产量碳足迹(CFy)及单位产值碳足迹(CFv)。以2002年为节点,把1993—2012年分为两个时间段,分析作物生产碳足迹的变化趋势以及华北平原47个市的作物生产碳足迹的分布、构成情况。根据1993—2012年不同市的平均单产,取5个单产最高与5个单产最低的市,分析华北平原高产市与低产市的碳足迹、单位面积投入以及作物构成。【结果】华北平原作物 CFs、CFc 在过去20年里呈增加趋势,CFs 平均值从时段Ⅰ的4.08 tCO2eq·hm^-2升高到时段Ⅱ的4.72 tCO2eq·hm^-2,平均变化率为0.66 tCO2eq·hm^-2·10a^-1;CFc 平均值从时段Ⅰ的6.81 tCO2eq·hm^-2升高到时段Ⅱ的8.12 tCO2eq·hm^-2,平均变化率为1.16 tCO2eq·hm^-2·10a^-1。华北平原作物 CFy、CFv 在过去20年里呈降低趋势,CFy 平均值从时段Ⅰ的0.54 tCO2eq·t-1下降到时段Ⅱ的0.42 tCO2eq·t-1,平均变化率为-0.12 tCO2eq·t-1·10a^-1;CFv 平均值从时段Ⅰ的3.91 tCO2eq·¥10^-4下降到时段Ⅱ的2.51 tCO2eq·¥10^-4,平均变化率为-1.60 tCO2eq·¥10^-4·10a^-1。华北平原不同区域作物生产碳足迹差异较大,沿海地区(唐山、天津、秦皇岛、东营、烟台等)CFs、CFc 较大,CFy、CFv 较小,河南南部地区(驻马店、信阳、平顶山、洛阳)CFs、CFc 较小,CFy、CFv 较大。高产市 CFs、CFc 显著高于低产市,CFy、CFv 显著低于低产市(P<0.05);高产市单位面积投入显著高于低产市,且蔬菜种17
|
| [18] |
[本文引用:]
|
| [19] |
Excessive use of N fertilizer in intensive agriculture can increase crop yield and at the same time cause high carbon (C) emissions. This study was conducted to determine optimized N fertilizer application for high grain yield and lower C emissions in summer corn (Zea mays L.). A ifeld experiment, including 0 (N0), 75 (N75), 150 (N150), 225 (N225), and 300 (N300) kg N ha–1 treatments, was carried out during 2010–2012 in the North China Plain (NCP). The results showed that grain yield, input energy, greenhouse gas (GHG) emissions, and carbon footprint (CF) were al increased with the increase of N rate, except net energy yield (NEY). The treatment of N225 had the highest grain yield (10 364.7 kg ha–1) and NEY (6.8%), but the CF (0.25) was lower than that of N300, which indicates that a rate of 225 kg N ha–1 can be optimal for summer corn in NCP. Comparing GHG emision compontents, N fertilizer (0–51.1%) was the highest and fol owed by electricity for irrigation (19.73–49.35%). We conclude that optimazing N fertilizer application rate and reducing electricity for irrigation are the two key measures to increase crop yield, improve energy efifciency and decrease GHG emissions in corn production.
|
| [20] |
[本文引用:2]
|
| [21] |
农业碳足迹理论可以系统评价农业生产过程中人为因素引起的碳排放,是构建低碳农业的理论基础,对实现低碳农业具有重要的指导意义。为探明农业生产中的碳足迹,本文基于河北吴桥县农户生产调查数据,利用农业碳足迹理论及研究方法,评价了华北平原冬小麦-夏玉米两熟种植模式的碳足迹。
|
| [22] |
提高农作物生产的碳效率是实现低碳农业的重要途径之一。为探明农业生产中的碳效率,本文以河北吴桥县为例,基于农户生产调查数据,利用投入产出法,对华北平原冬小麦、夏玉米和棉花3种主要作物生产的碳投入、碳产出和碳效率进行了评价。结果表明,冬小麦、夏玉米和棉花生产的碳投入总量分别为943.47±225.14、525.74±134.73和513.60±138.94 kg CE km<sup>-2</sup>,其中化肥和电能占总量的大部分,分别约占60%和25%。3种作物碳的产出总量分别为8 430.70±774.45、7 194.50± 754.58和5 486.00±547.69 kg CE hm<sup>-2</sup>,其中秸秆约占总量的50%,经济产量约占34%,根约占17%。冬小麦、夏玉米和棉花碳的生产效率分别为7.95±2.55、15.90±4.34和7.60±2.92 kg kg<sup>-1</sup> CE,碳的经济效率分别为13.28±4.56、21.47±5.86和76.70±29.45 CHY kg<sup>-1</sup> CE,碳的生态效率分别为9.59±3.07、14.57±3.98和11.69±4.49 kg C kg<sup>-1</sup> CE,作物间的碳效率差异显著,初步表明在华北平原,夏玉米生产的碳综合效率最高,棉花次之,冬小麦最低。
|
| [23] |
[本文引用:1]
|
| [24] |
缺乏完善的本地化LCA(Life Cycle Assessment)数据库是国内广泛开展LCA研究与应用的主要障碍.本文总结提出了建立中国生命周期参考数据库(Chinese Reference Life Cycle Database,CLCD)的基本方法,包括环境影响类型与物质名录的选择、单元过程清单数据的收集与审核、生命周期清单数据的建模与计算、CLCD数据库的建立等4个方面.按照上述方法,以电力、煤炭、燃油、运输等基础性产品为核心,初步建立了可扩展的中国基础工业系统的生命周期模型,收集了单元过程的全国平均清单数据,通过模型计算获得了这些基础性产品的生命周期清单数据,从而得到了CLCD基础数据库,为下一步扩展为更完善的CLCD数据库提供了方法与模型基础.
Magsci
[本文引用:5]
|
| [25] |
[本文引用:1]
|
| [26] |
URL
[本文引用:3]
|
| [27] |
URL
[本文引用:1]
|
| [28] |
Increasing atmospheric concentrations of greenhouse gases has caused grievous global warming and associated consequences. Lowering carbon footprint to promote the development of cleaner production demands the immediate attention. In this study, the carbon footprint calculations were performed on five cropping systems in North China Plain from 2003 to 2010. The five cropping systems included sweet potato -> cotton -> sweet potato -> winter wheat-summer maize (SpCSpWS, 4-year cycle), ryegrass-cotton -> peanut -> winter wheat-summer maize (RCPWS, 3-year cycle), peanut -> winter wheat-summer maize (PWS, 2-year cycle), winter wheat-summer maize (WS, 1-year cycle), and continuous cotton (Cont C), established in a randomized complete-block design with three replicates. We used a modified carbon footprint calculation with localized greenhouse gas emissions parameters to analyze the carbon footprint of each cropping system per unit area, per kg biomass, and per unit economic output. Results showed that the lowest annual carbon footprint values were observed in SpCSpWS among the five cropping systems, which were only 27.9%, 28.2% and 25.0% of those in WS rotation system (the highest carbon footprint) in terms of per unit area, per unit biomass, and per unit economic output, respectively. The five cropping systems showed the order of SpCSpWS < Cont C < RCPWS < PWS < WS sorting by their annual carbon footprint calculated by all the three metrics above-mentioned. Results revealed that appropriate diversified crop rotation systems could contribute to decreased carbon footprint compared with conventional intensive crop production system in North China Plain. (C) 2014 Elsevier Ltd. All rights reserved.
|
| [29] |
[本文引用:1]
|
| [30] |
The agriculture sector contributes significantly to global carbon emissions from diverse sources such as product and machinery manufacture, transport of materials and direct and indirect soil greenhouse gas emissions. In this article, we use farm survey data from the east of Scotland combined with published estimates of emissions for individual farm operations to quantify the relative contribution of a range of farming operations and determine the carbon footprint of different crops (e.g. legumes, winter and spring cereals, oilseed rape, potato) and farming practices (conventional, integrated and organic). Over all crops and farm types, 75% of the total emissions result from nitrogen fertilizer use (both organic and inorganic) 鈥 from production, application, and direct nitrous oxide emissions from the soil resulting from application. Once nitrogen is accounted for, there are no major differences between organic, integrated or conventional farming practices. These data highlight opportunities for carbon mitigation and will be of value for inclusion in full life cycle analyses of arable production systems and in calculations of greenhouse gas balance associated with land-use change.
|
| [31] |
近10多年来,国内外农田生态系统碳足迹研究蓬勃开展并取得了某些成果。同时也存在着问题与 误区,主要是碳流路径的短路和指标逻辑起点不一,导致研究结果的失真与扭曲。该文论述了全环式与半环式碳流路径的利弊,提出了改进3原则,对当前世界流行 的5种指标体系进行比较、综合、筛选、补充与改进,初步形成了适合中国实际情况的包括碳流路径、指标体系及相应参数的碳足迹方法论,并通过1950年以来 的全国性农田系统碳流分析和现代高效农田的案例加以验证和剖析,与当前流行的一些主流观点相悖,运用改进的碳足迹法进行的案例研究发现:(1)与多年生林 木相似,农田上连年种植的一年生作物同样具有净固碳作用;(2)1952~2012年期间,随着农业集约化程度的不断提高,全国农田生态系统碳效率仍保持 在正平衡状态;(3)尽管农田化合物大量投入,但在农田生态系统内增加的固碳量仍超过耗碳量,化学合成物在农田生态系统的合理应用也有减少温室气体的可能 性。
|
| [32] |
近10多年来,国内外农田生态系统碳足迹研究蓬勃开展并取得了某些成果。同时也存在着问题与误区,主要是碳流路径的短路和指标逻辑起点不一,导致研究结果的失真与扭曲。该文论述了全环式与半环式碳流路径的利弊,提出了改进3原则,对当前世界流行的5种指标体系进行比较、综合、筛选、补充与改进,初步形成了适合中国实际情况的包括碳流路径、指标体系及相应参数的碳足迹方法论,并通过1950年以来的全国性农田系统碳流分析和现代高效农田的案例加以验证和剖析,与当前流行的一些主流观点相悖,运用改进的碳足迹法进行的案例研究发现:(1)与多年生林木相似,农田上连年种植的一年生作物同样具有净固碳作用;(2)1952~2012年期间,随着农业集约化程度的不断提高,全国农田生态系统碳效率仍保持在正平衡状态;(3)尽管农田化合物大量投入,但在农田生态系统内增加的固碳量仍超过耗碳量,化学合成物在农田生态系统的合理应用也有减少温室气体的可能性。
|
