×
模态框(Modal)标题
在这里添加一些文本
Close
Close
Submit
Cancel
Confirm
×
模态框(Modal)标题
×
Toggle navigation
Home
About
About Journal
Editor-in-Chief
Editorial Board
Awards and Honors
Indexed In
Impact Factor
Instruction
Instruction for Authors
Fees
Online Submission
Journal Online
Just Accepted
Current Issue
Archive
Most Read
Most Download
Most Cited
E-mail Alert
RSS
Specification
Paper Structure/Writing
Word Standardization
Unit of Measurement
Punctuation
Typographic Format/Template
Reference Format
Subscription
Advertising Service
Advertising Notice
Advertising Fee
Contact Us
中文
China Cotton
Figure/Table detail
Genetic diversity and haplotype analysis of cotton Fusarium wilt based on gene sequences of EF-1α and β-tubulin
Wang Haiying, Chen Xiaohai, Zhong Yeyi, Gong Juwu, Liu Ping, Chin Yaoxian, Wang Peizheng, Yuan Youlu
Cotton Science
, 2023, 35(
4
): 334-344. DOI:
10.11963/cs20220060
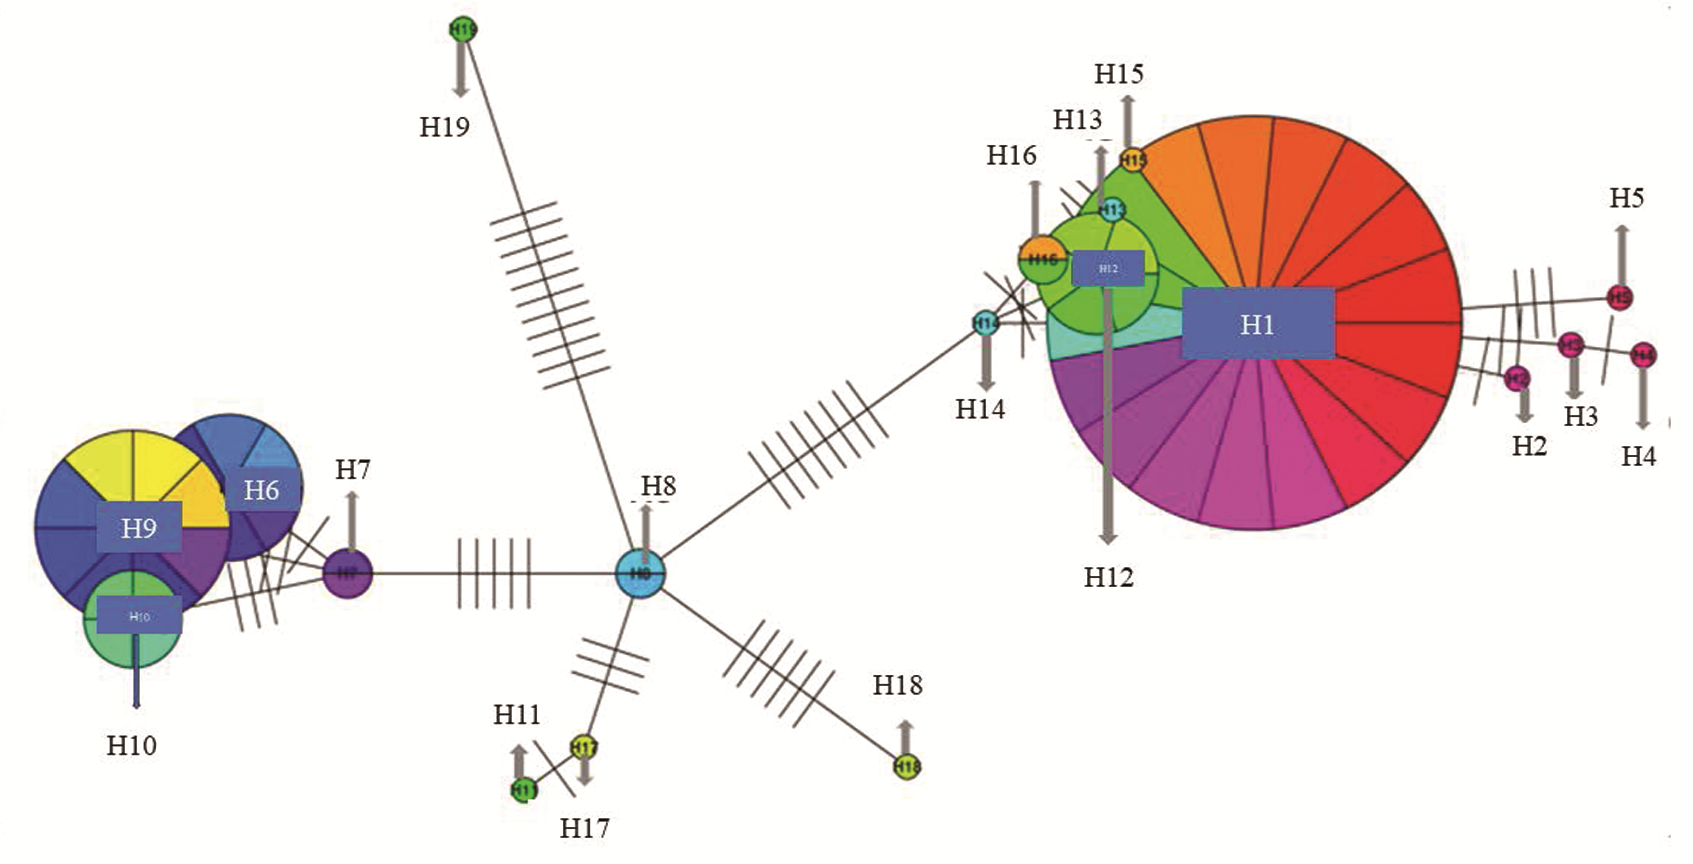
Fig. 4
Haplotype network map constructed based on β-tubulin gene sequence
The number of short horizontal lines indicates the number of mutated bases between two haplotypes.
Other figure/table from this article
Table 1
GenBank accession number of EF-1α and β-tubulin gene of cotton Fusarium wilt
Fig. 1
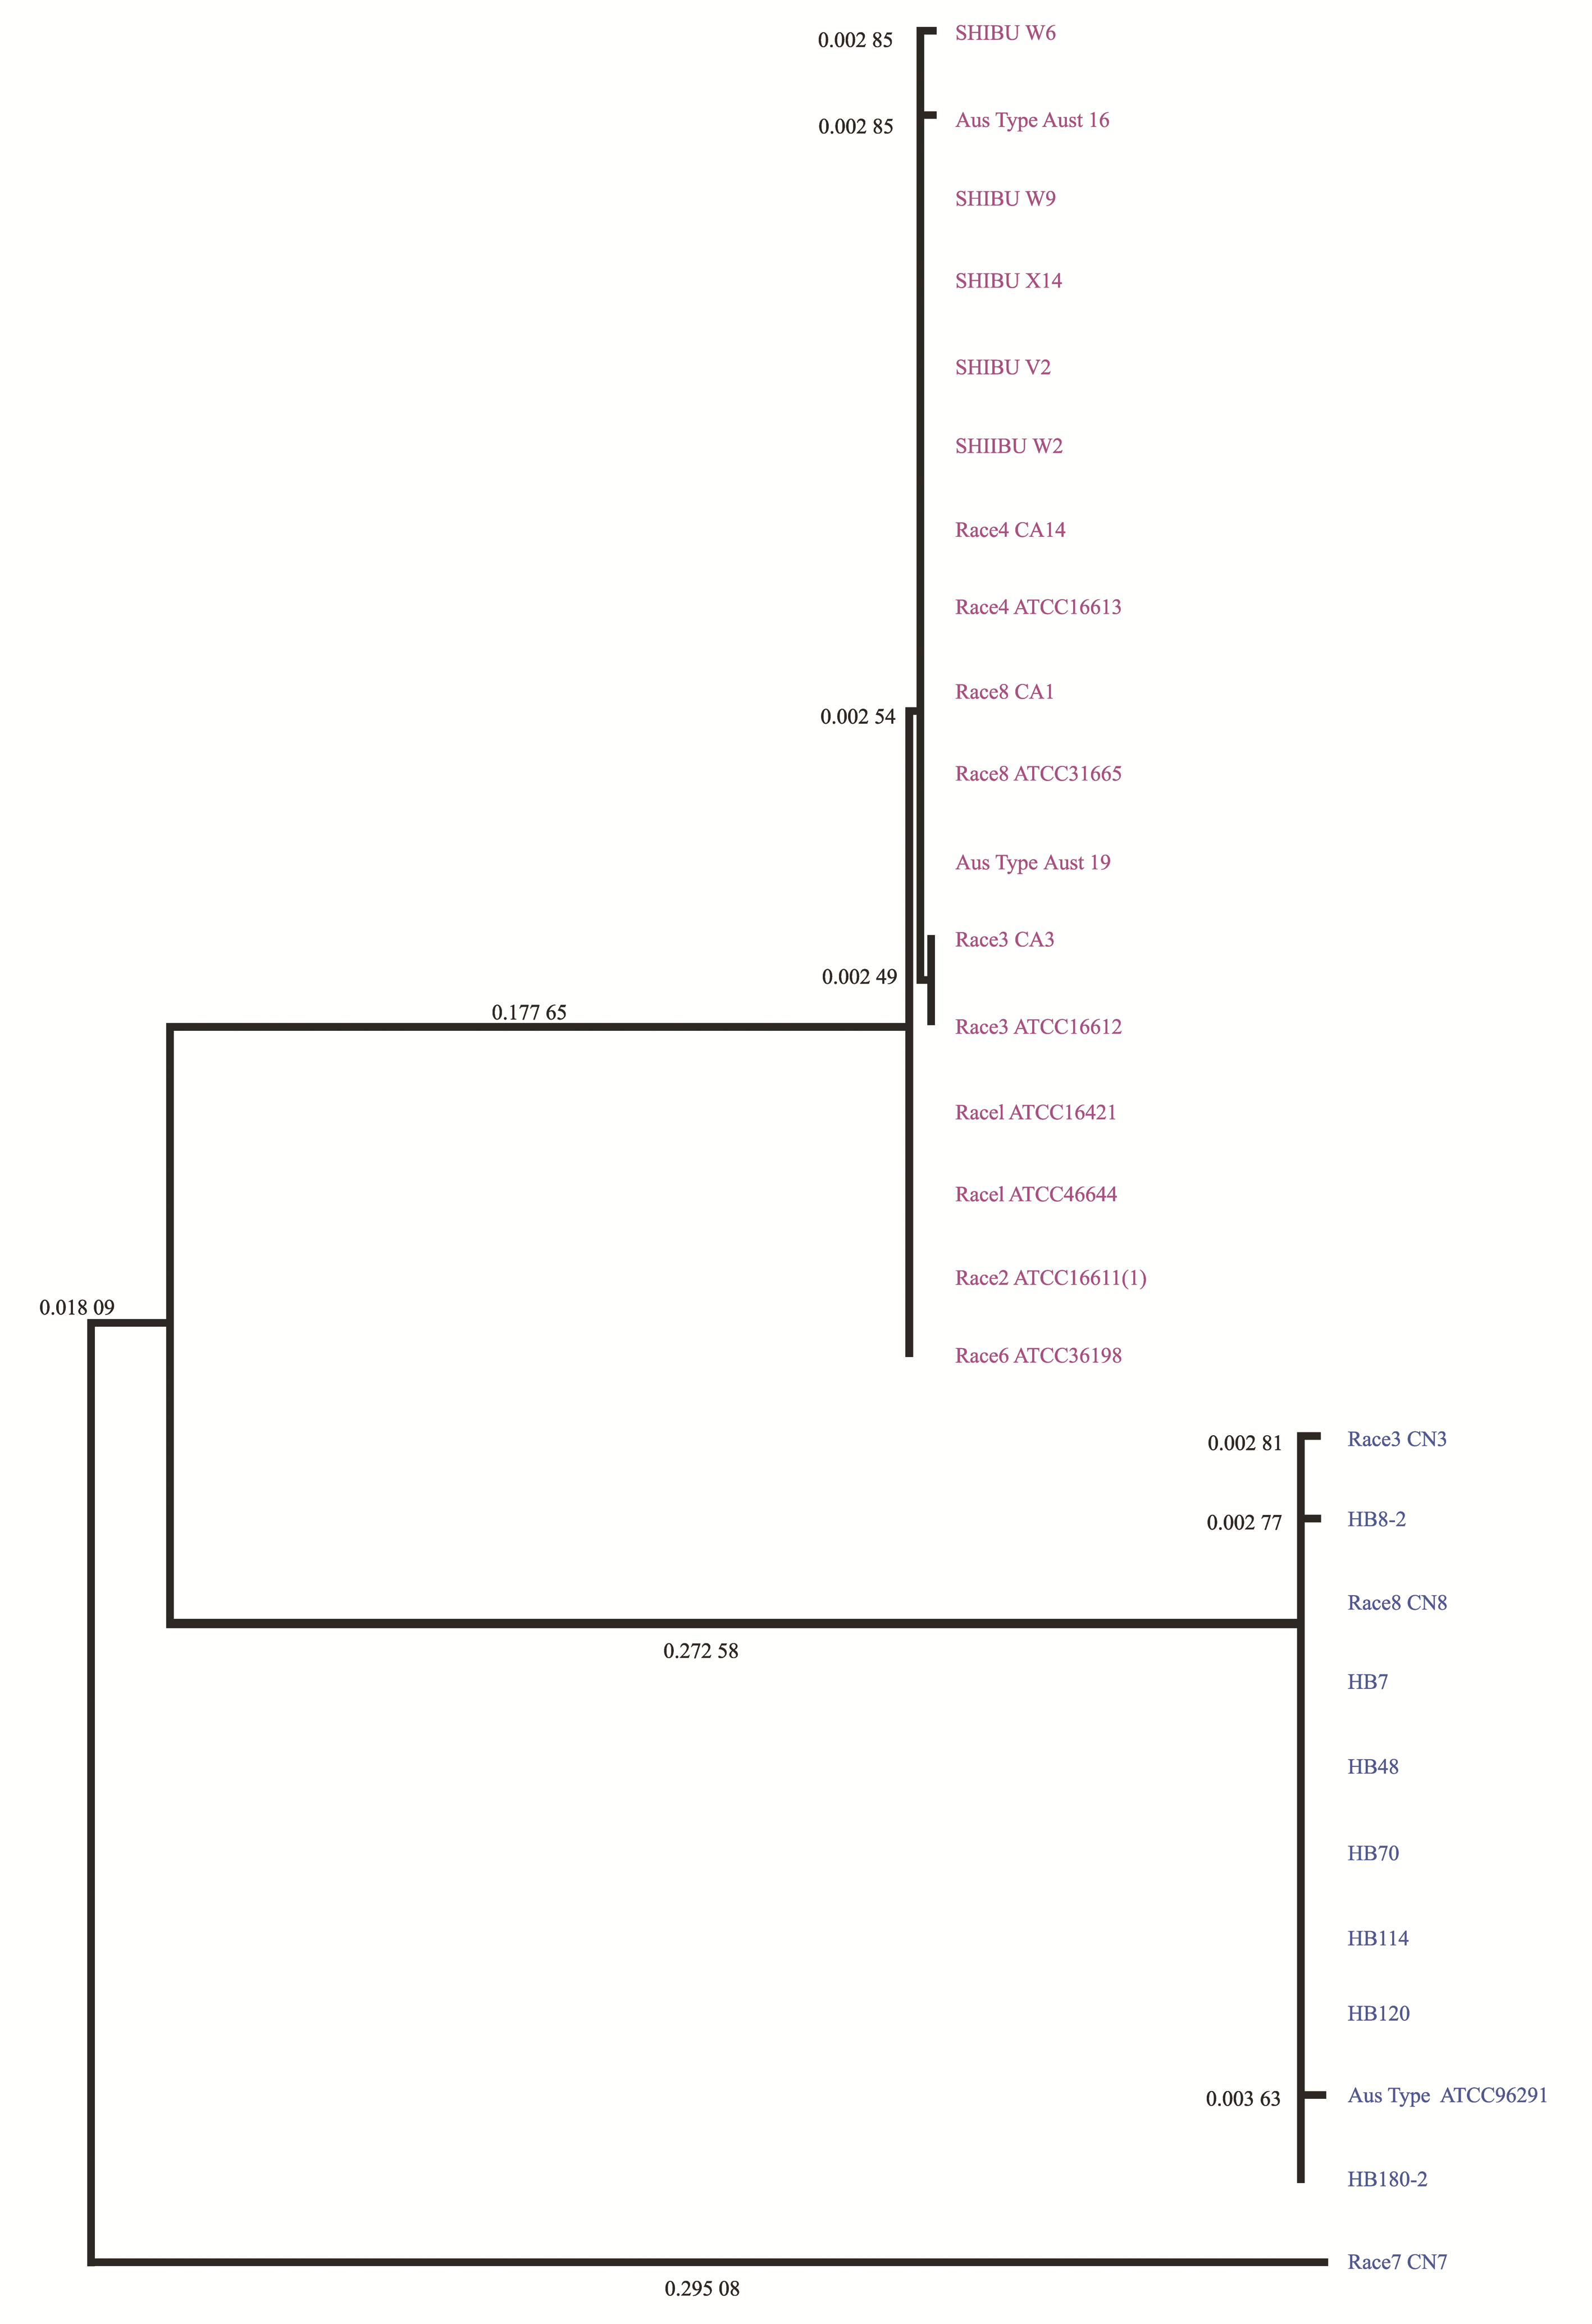
Phylogenetic tree based on EF-1α gene sequence of cotton Fusarium wilt strains
The value on each branch is the degree of genetic variation, which indicates the frequency of base replacement at each site in the gene. The calculation formula is: degree of variation = the number of mutated bases/the total number of bases.
Fig. 2
Phylogenetic tree based on β-tubulin gene sequence of cotton Fusarium wilt strains
The value on each branch is the degree of genetic variation, which indicates the frequency of base replacement at each site in the gene. The calculation formula is: degree of variation = the number of mutated bases/the total number of bases.
Table 2
Haplotype characteristics of EF-1α and β-tubulin gene
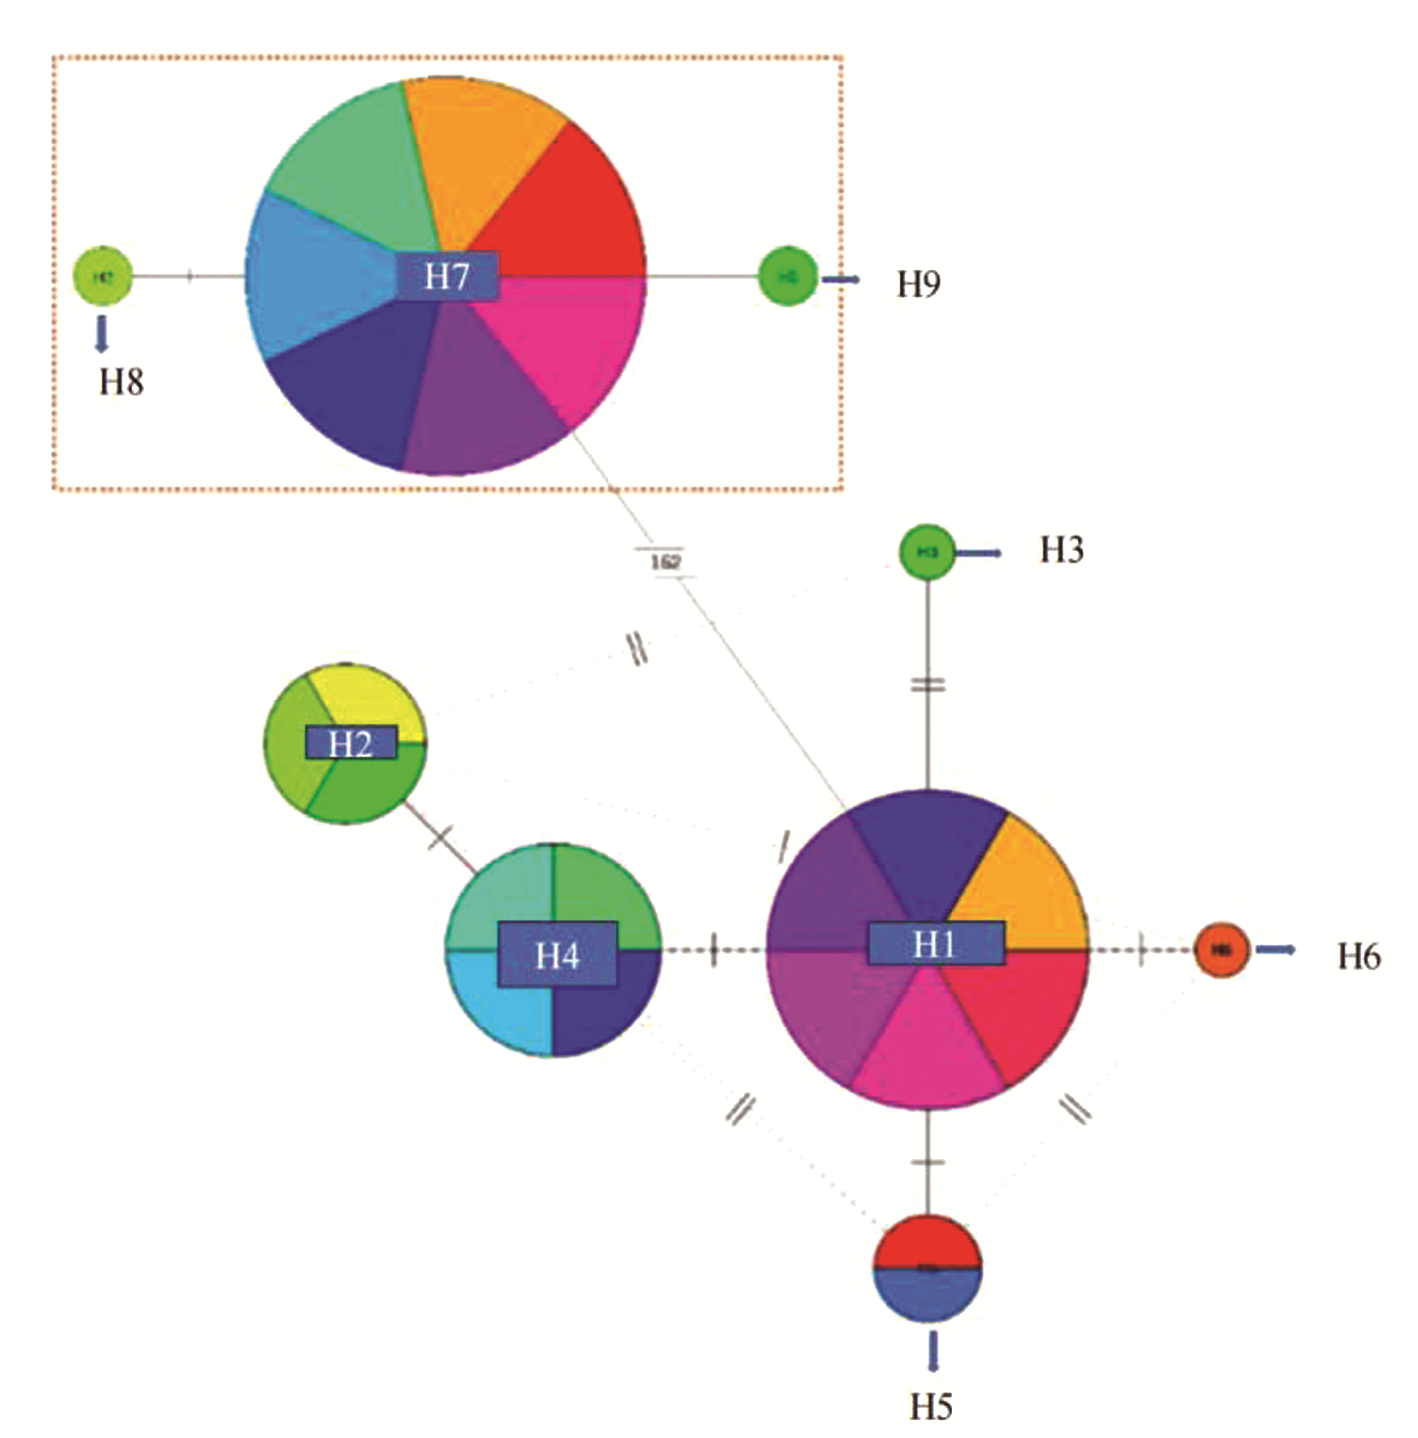
Fig. 3
Haplotype network map constructed based on EF-1α gene sequence
The number of short horizontal lines indicates the number of mutated bases between two haplotypes.
Table 3
Haplotype analysis based on EF-1α gene sequence
Table 4
Haplotype analysis based on β-tubulin gene sequence