| 模型 Model | 精确率 Precision/ % | 召回率 Recall/ % | 平均精度AP/% | 平均精度均值 mAP/% | 权重 Weight file size/Mb | |||
|---|---|---|---|---|---|---|---|---|
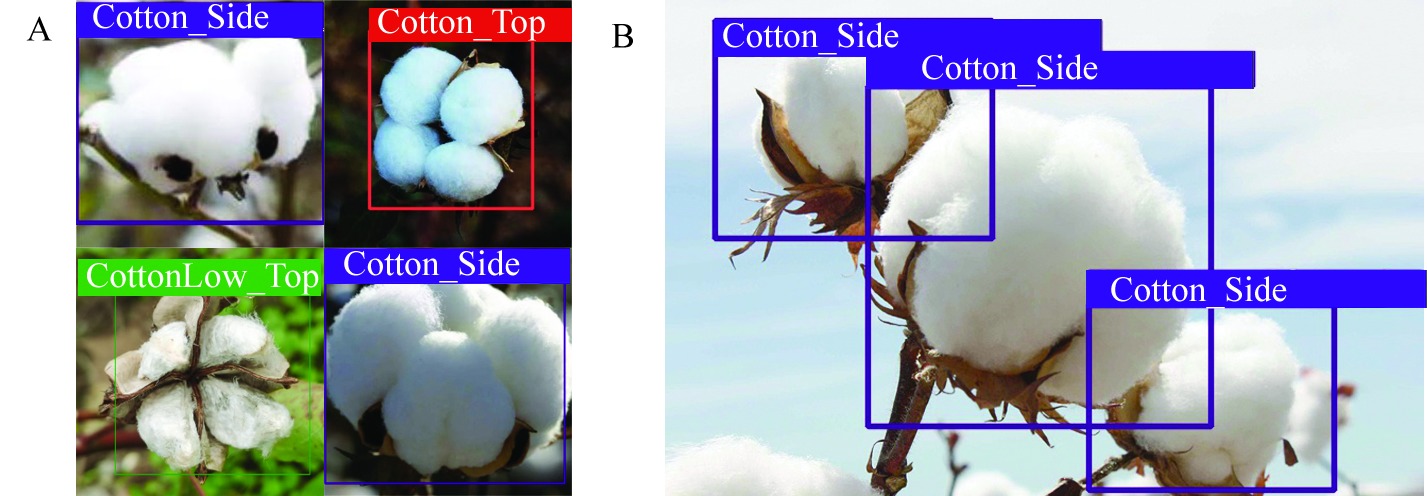
| 正面普通棉花 Positive normal cotton | 正面低品级棉花 Positive low-grade cotton | 侧面棉花 Side cotton | 其他白色花朵 Other white flowers | |||||
| SSD | 74.3 | 52.7 | 72.3 | 66.5 | 71.9 | 69.1 | 70.0 | 93.2 |
| Fast R-CNN | 59.7 | 44.8 | 42.3 | 38.7 | 41.5 | 38.4 | 40.2 | 108.0 |
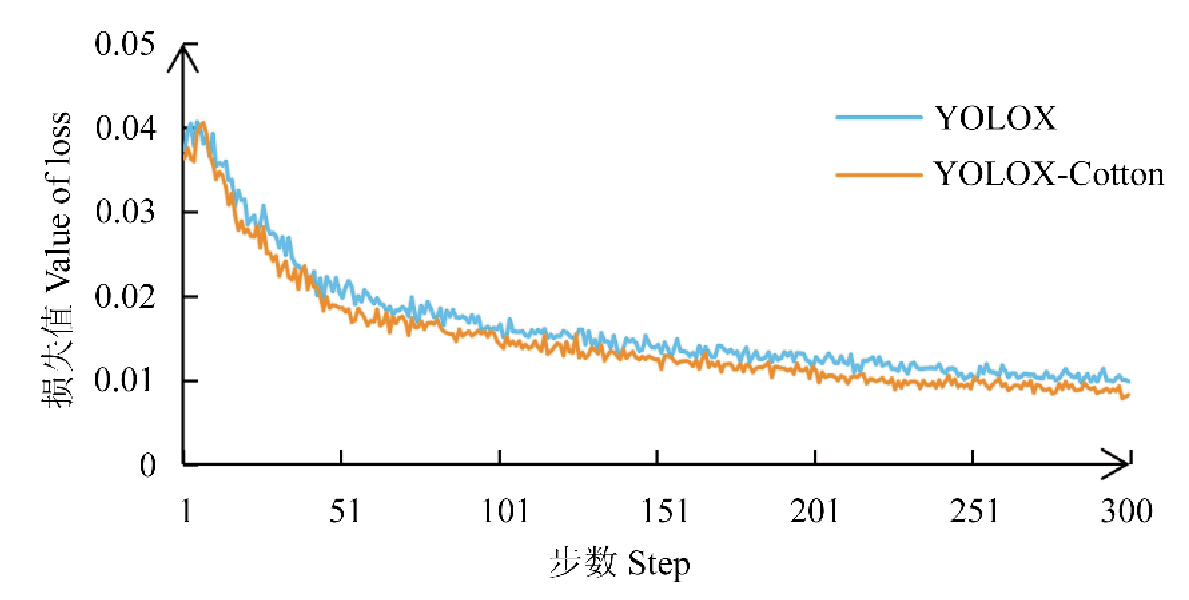
| YOLOX | 87.7 | 81.3 | 88.9 | 85.2 | 87.4 | 83.8 | 86.3 | 14.7 |
| YOLOv8 | 87.1 | 79.2 | 87.2 | 84.3 | 86.7 | 83.4 | 85.4 | 22.5 |
| YOLOX-Cotton | 92.9 | 86.8 | 94.6 | 91.8 | 93.2 | 90.2 | 92.4 | 18.3 |
Fig. 3 Recognition module network structure in this study Focus is the slicing operation module for the input image; C3 is the concentrated comprehensive convolution block; CBS is the convolution unit; Concat indicates feature stitching; Upsample is feature upsampling; Detect is the detection module; Dark is DarkNet, and Dark+CA is the CA module added after the Dark module.
Fig. 4 The structure of CA module C denotes the depth of the feature channel; H and W denote the height and width of the feature; r is the indentation ratio; X Avg Pool denotes horizontal global pooling; Y Avg Pool denotes vertical global pooling; Conv2d denotes convolutional 2D; BN denotes batch normalization; Sigmoid is an activation function
Fig. 5 Prediction box and ground truth box of the model $b_{c_{x}}^{g t}$, $b_{c_{y}}^{g t}$ are the coordinates of the center point Bgt of the real box (ground truth box), and $b_{c_{x}}$, $b_{c_{y}}$ are the coordinates of the center point B of the prediction box; h and w are the length and width of the prediction box, and hgt, wgt are the length and width of the real box; σ is the straight line distance between the point Bgt and the point B; ch and cw are the distance between the center point of the two boxes in the vertical direction and the distance in the horizontal direction; ch and cw are the height and width of the smallest outer rectangle of the real box and the prediction box; α is the angle between the center point of the real box and the center point of the prediction box in the horizontal direction.
Fig. 7 Schematic diagram of the disparity calculation The figure uses two directional axes, Z and X; Oleft and Oright are the left and right camera optical centers, respectively; P is the positioning point on the object to be measured; Pleft and Pright are the imaging points of the positioning point P on the left and right camera optical sensors, respectively; xleft and xright are the distances of Pleft and Pright from the optical axis of the left and right cameras, respectively; f is the camera focal length; b is the distance between the centers of the two cameras; x is the coordinate of point P on the X-axis; Baseline is the line connecting the optical centers of the left and right cameras.
Fig. 10 Field cotton category recognition results based on YOLOX-Cotton Cotton_Side represents the side cotton identified based on YOLOX-Cotton model; Cotton_Top represents the positive normal cotton; CottonLow_Top represents the positive side of low-grade cotton. The number at the end of the cotton grade represents confidence.