| 模型Model | 建模集 Modelling dataset | 验证集 Validation dataset | |||||
|---|---|---|---|---|---|---|---|
| R2 | RMSE/(mg·L-1) | RPD | R2 | RMSE/(mg·L-1) | RPD | ||
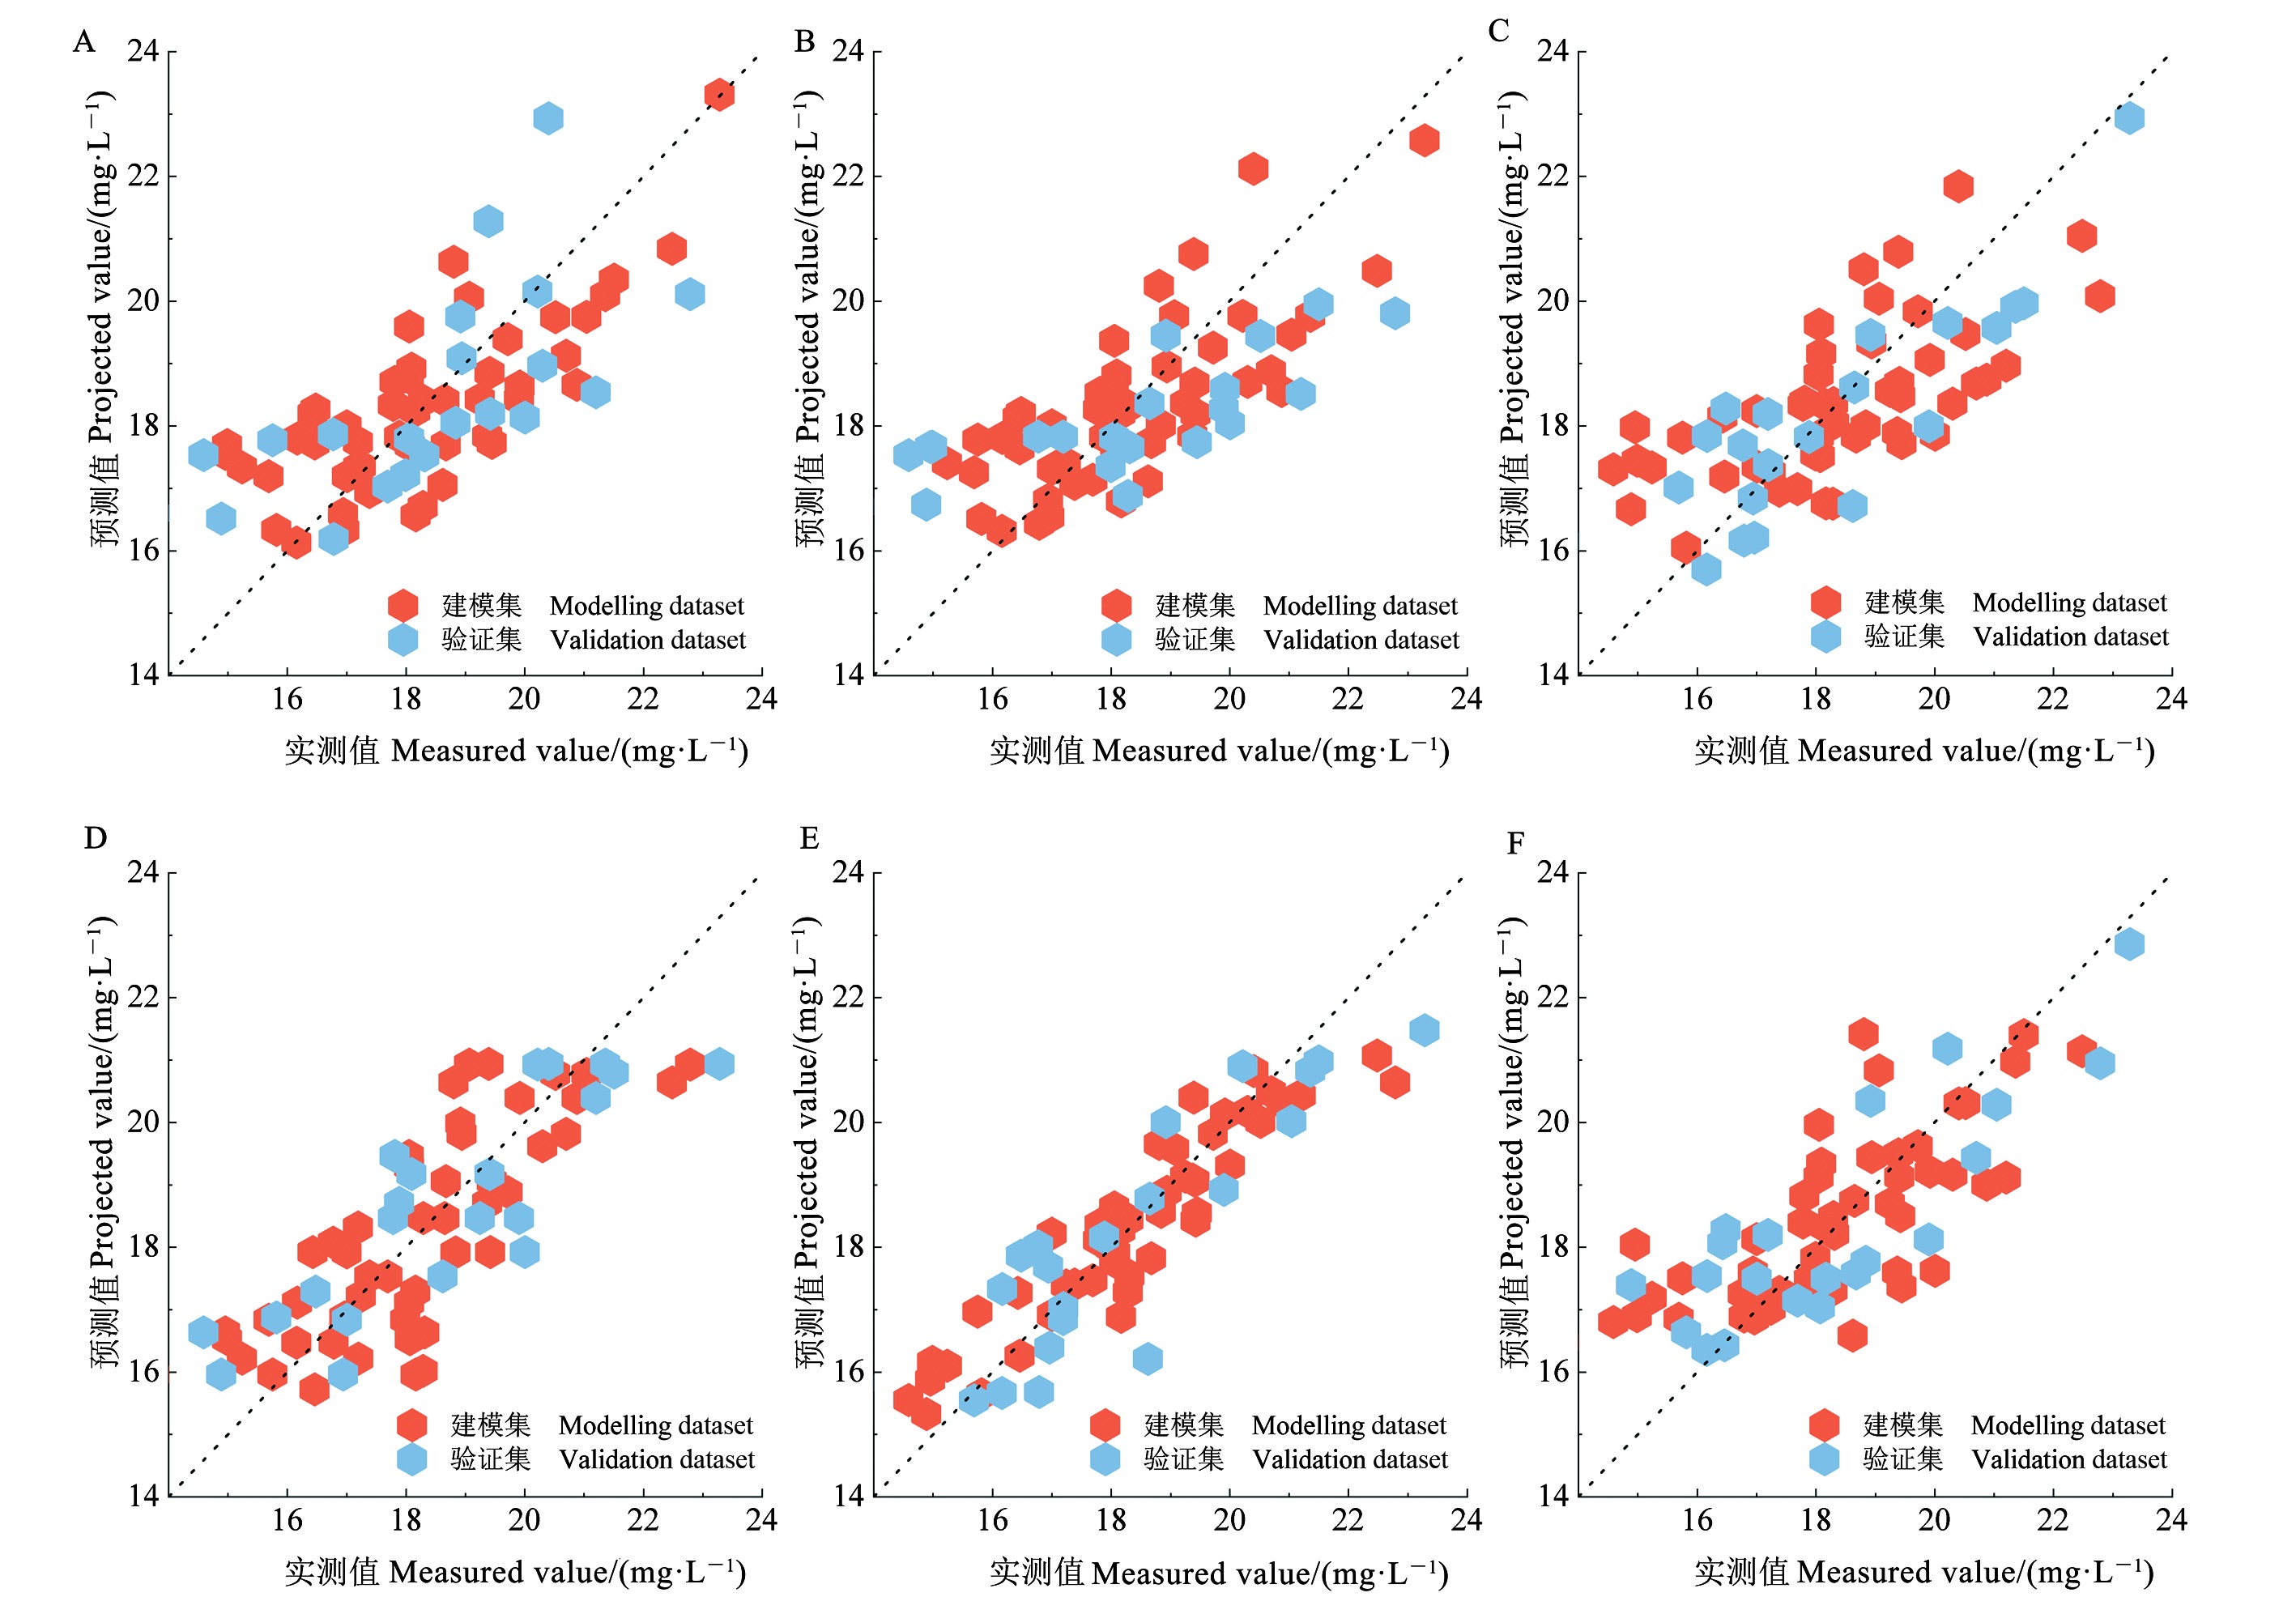
| LASSO | 0.563 | 1.252 | 1.513 | 0.436 | 1.677 | 1.331 | |
| RR | 0.571 | 1.166 | 1.526 | 0.434 | 1.838 | 1.330 | |
| PLSR | 0.363 | 1.391 | 1.253 | 0.687 | 1.364 | 1.786 | |
| KNNR | 0.609 | 1.170 | 1.600 | 0.722 | 1.176 | 1.899 | |
| RFR | 0.856 | 0.709 | 2.634 | 0.742 | 1.158 | 1.969 | |
| SVR | 0.511 | 2.634 | 1.430 | 0.697 | 1.236 | 1.816 | |