×
模态框(Modal)标题
在这里添加一些文本
Close
Close
Submit
Cancel
Confirm
×
模态框(Modal)标题
×
Toggle navigation
Home
About
About Journal
Editor-in-Chief
Editorial Board
Awards and Honors
Indexed In
Impact Factor
Instruction
Instruction for Authors
Fees
Online Submission
Journal Online
Just Accepted
Current Issue
Archive
Most Read
Most Download
Most Cited
E-mail Alert
RSS
Specification
Paper Structure/Writing
Word Standardization
Unit of Measurement
Punctuation
Typographic Format/Template
Reference Format
Subscription
Advertising Service
Advertising Notice
Advertising Fee
Contact Us
中文
China Cotton
Figure/Table detail
Estimation of chlorophyll content in cotton canopy using UAV multispectral imagery and machine learning algorithms
Zhao Xin, Li Zhaoyang, Wang Hongbo, Liu Jiangfan, Jiang Wenge, Zhao Zeyi, Wang Xingpeng, Gao Yang
Cotton Science
, 2024, 36(
1
): 1-13. DOI:
10.11963/cs20230026
波段名称
Band name
简称
Abbreviation
中心波长
Center wavelength/nm
波段宽度
Band width/nm
近红外1 Near infrared 1
NIR 1
800
80
蓝光 Blue band
B
490
80
绿光 Green band
G
550
70
红光 Red band
R
680
80
红边 Red edge band
RE
720
100
近红外2 Near infrared 2
NIR 2
900
140
Table 2
Multispectral camera sensor parameters
Other figure/table from this article
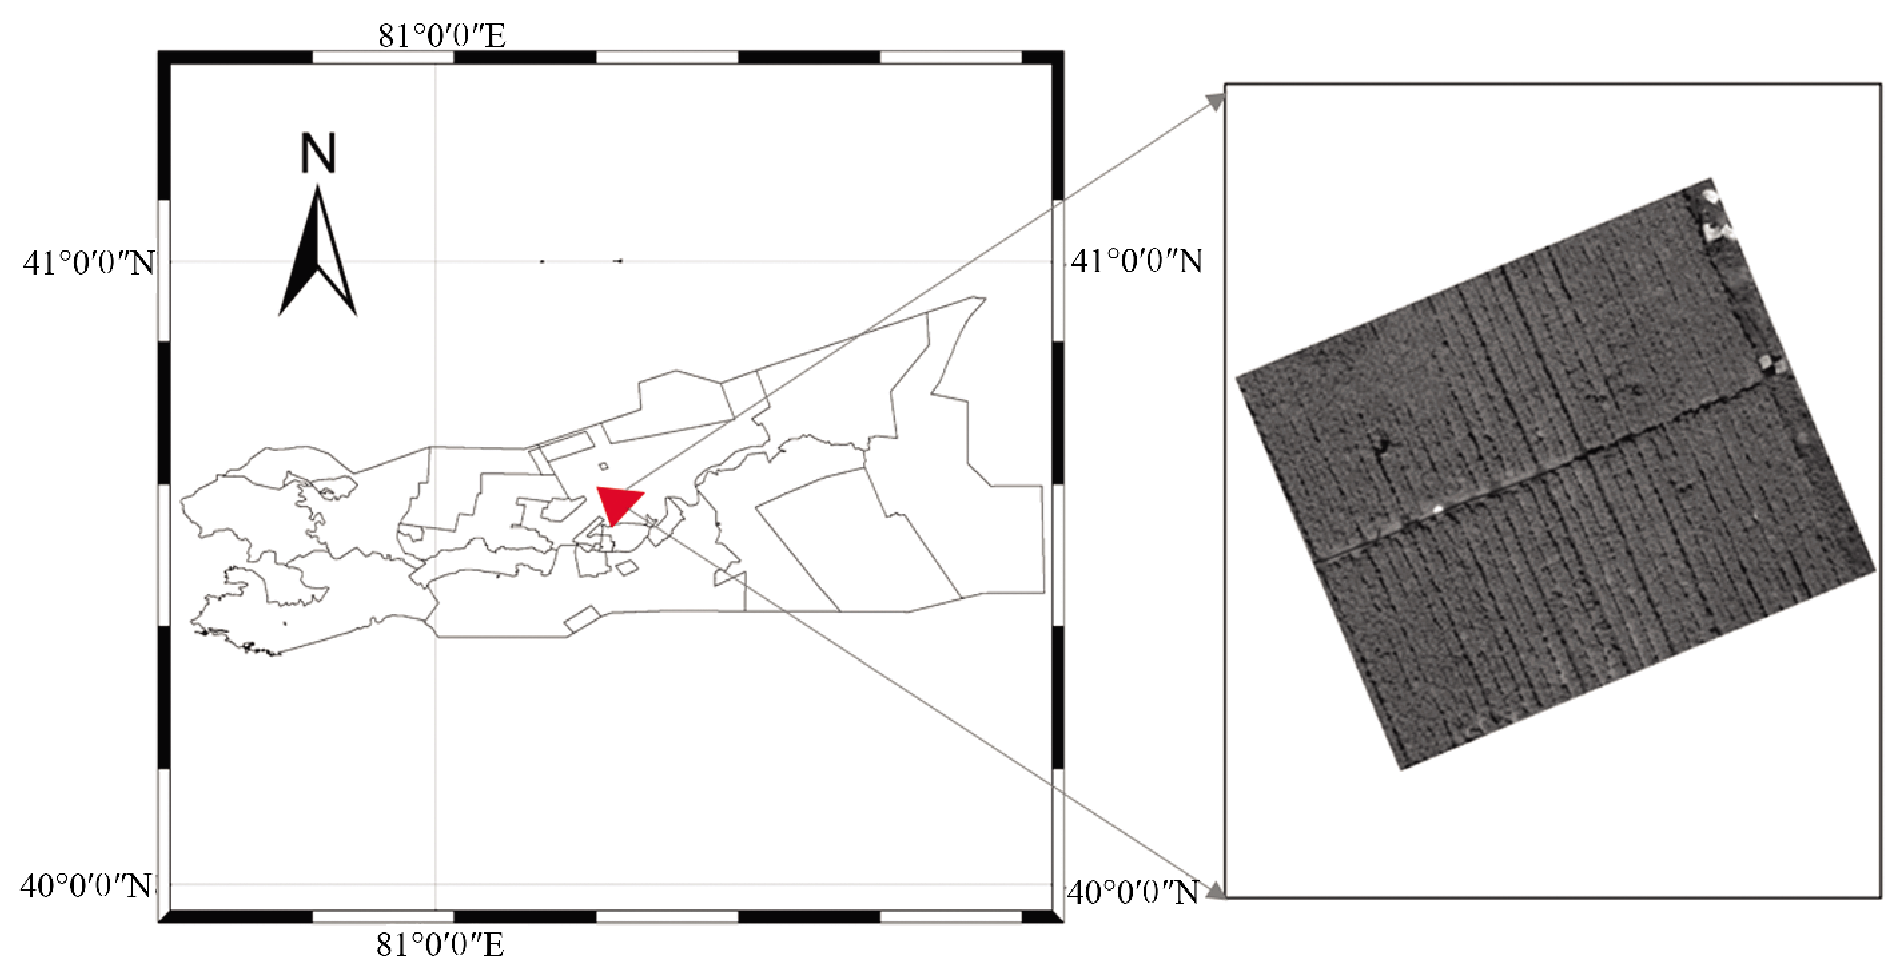
Fig. 1
Overview map of the experimental area
Table 1
Basic soil nutrient content of experimental field
Table 3
Calculation formula for vegetation index
Table 4
Statistical description of chlorophyll content in cotton canopy leaves
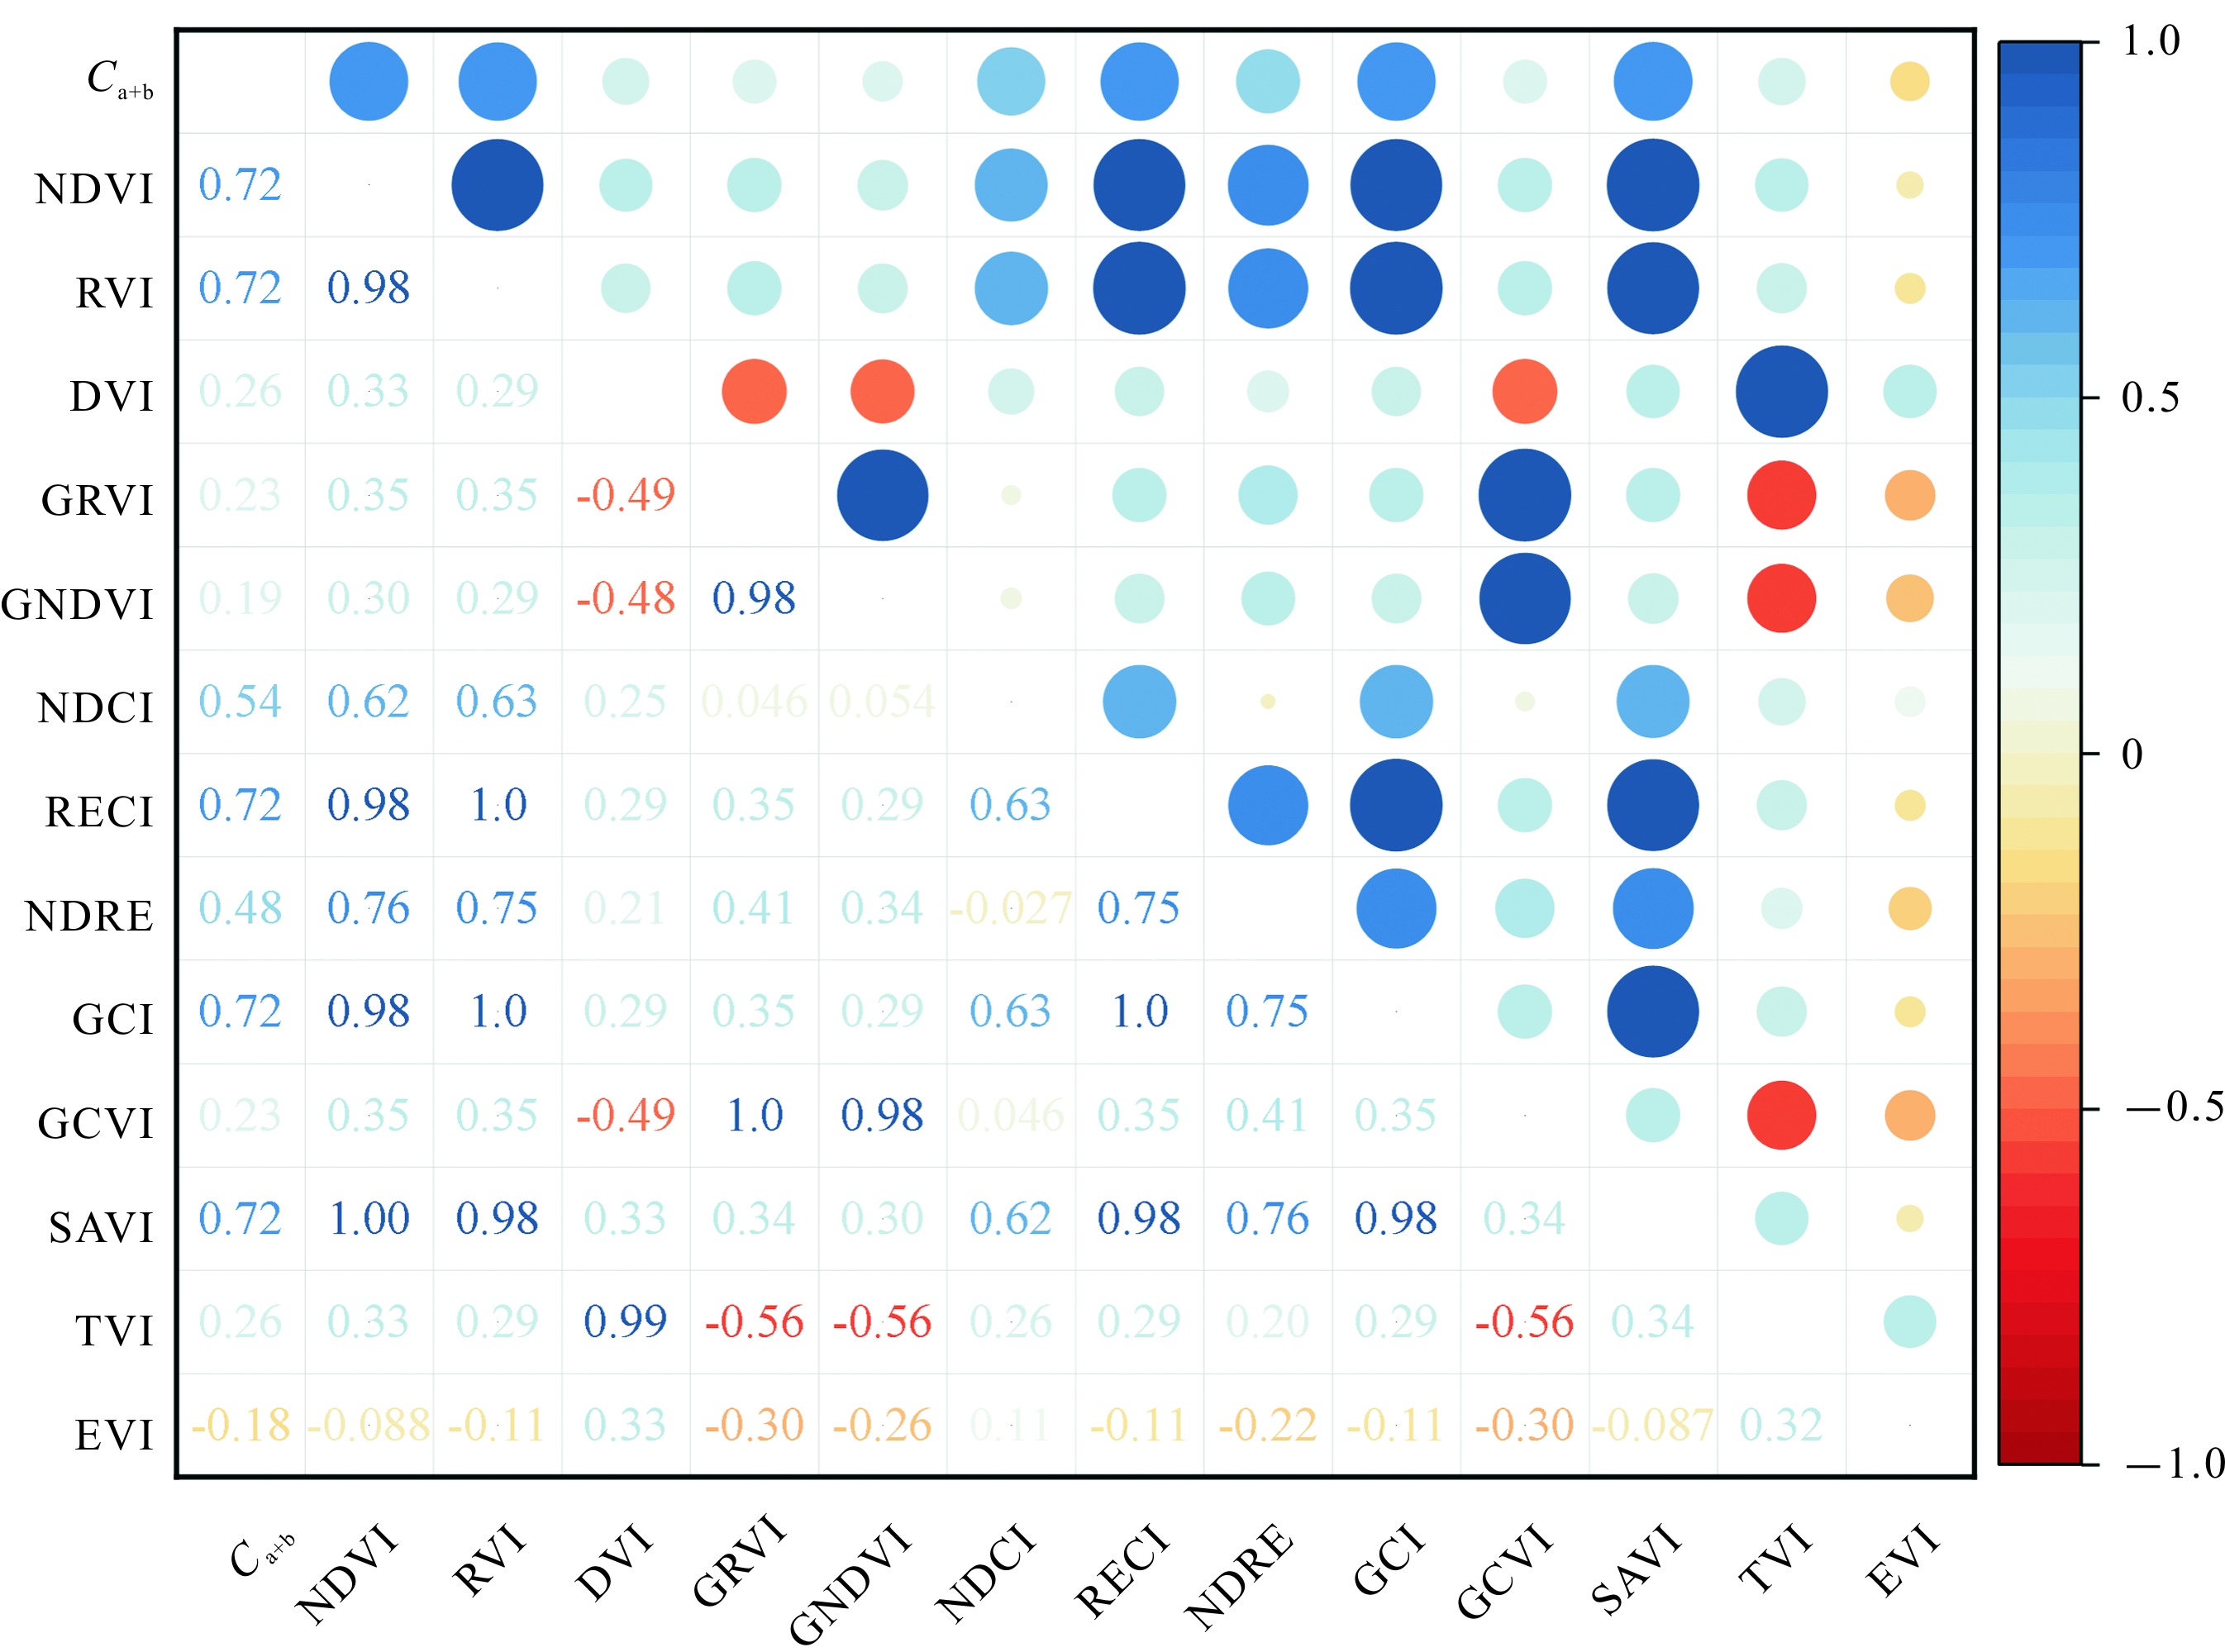
Fig. 2
The correlation coefficient between vegetation index and chlorophyll content
Table 5
Simple linear model of vegetation index and SPAD and the model validation
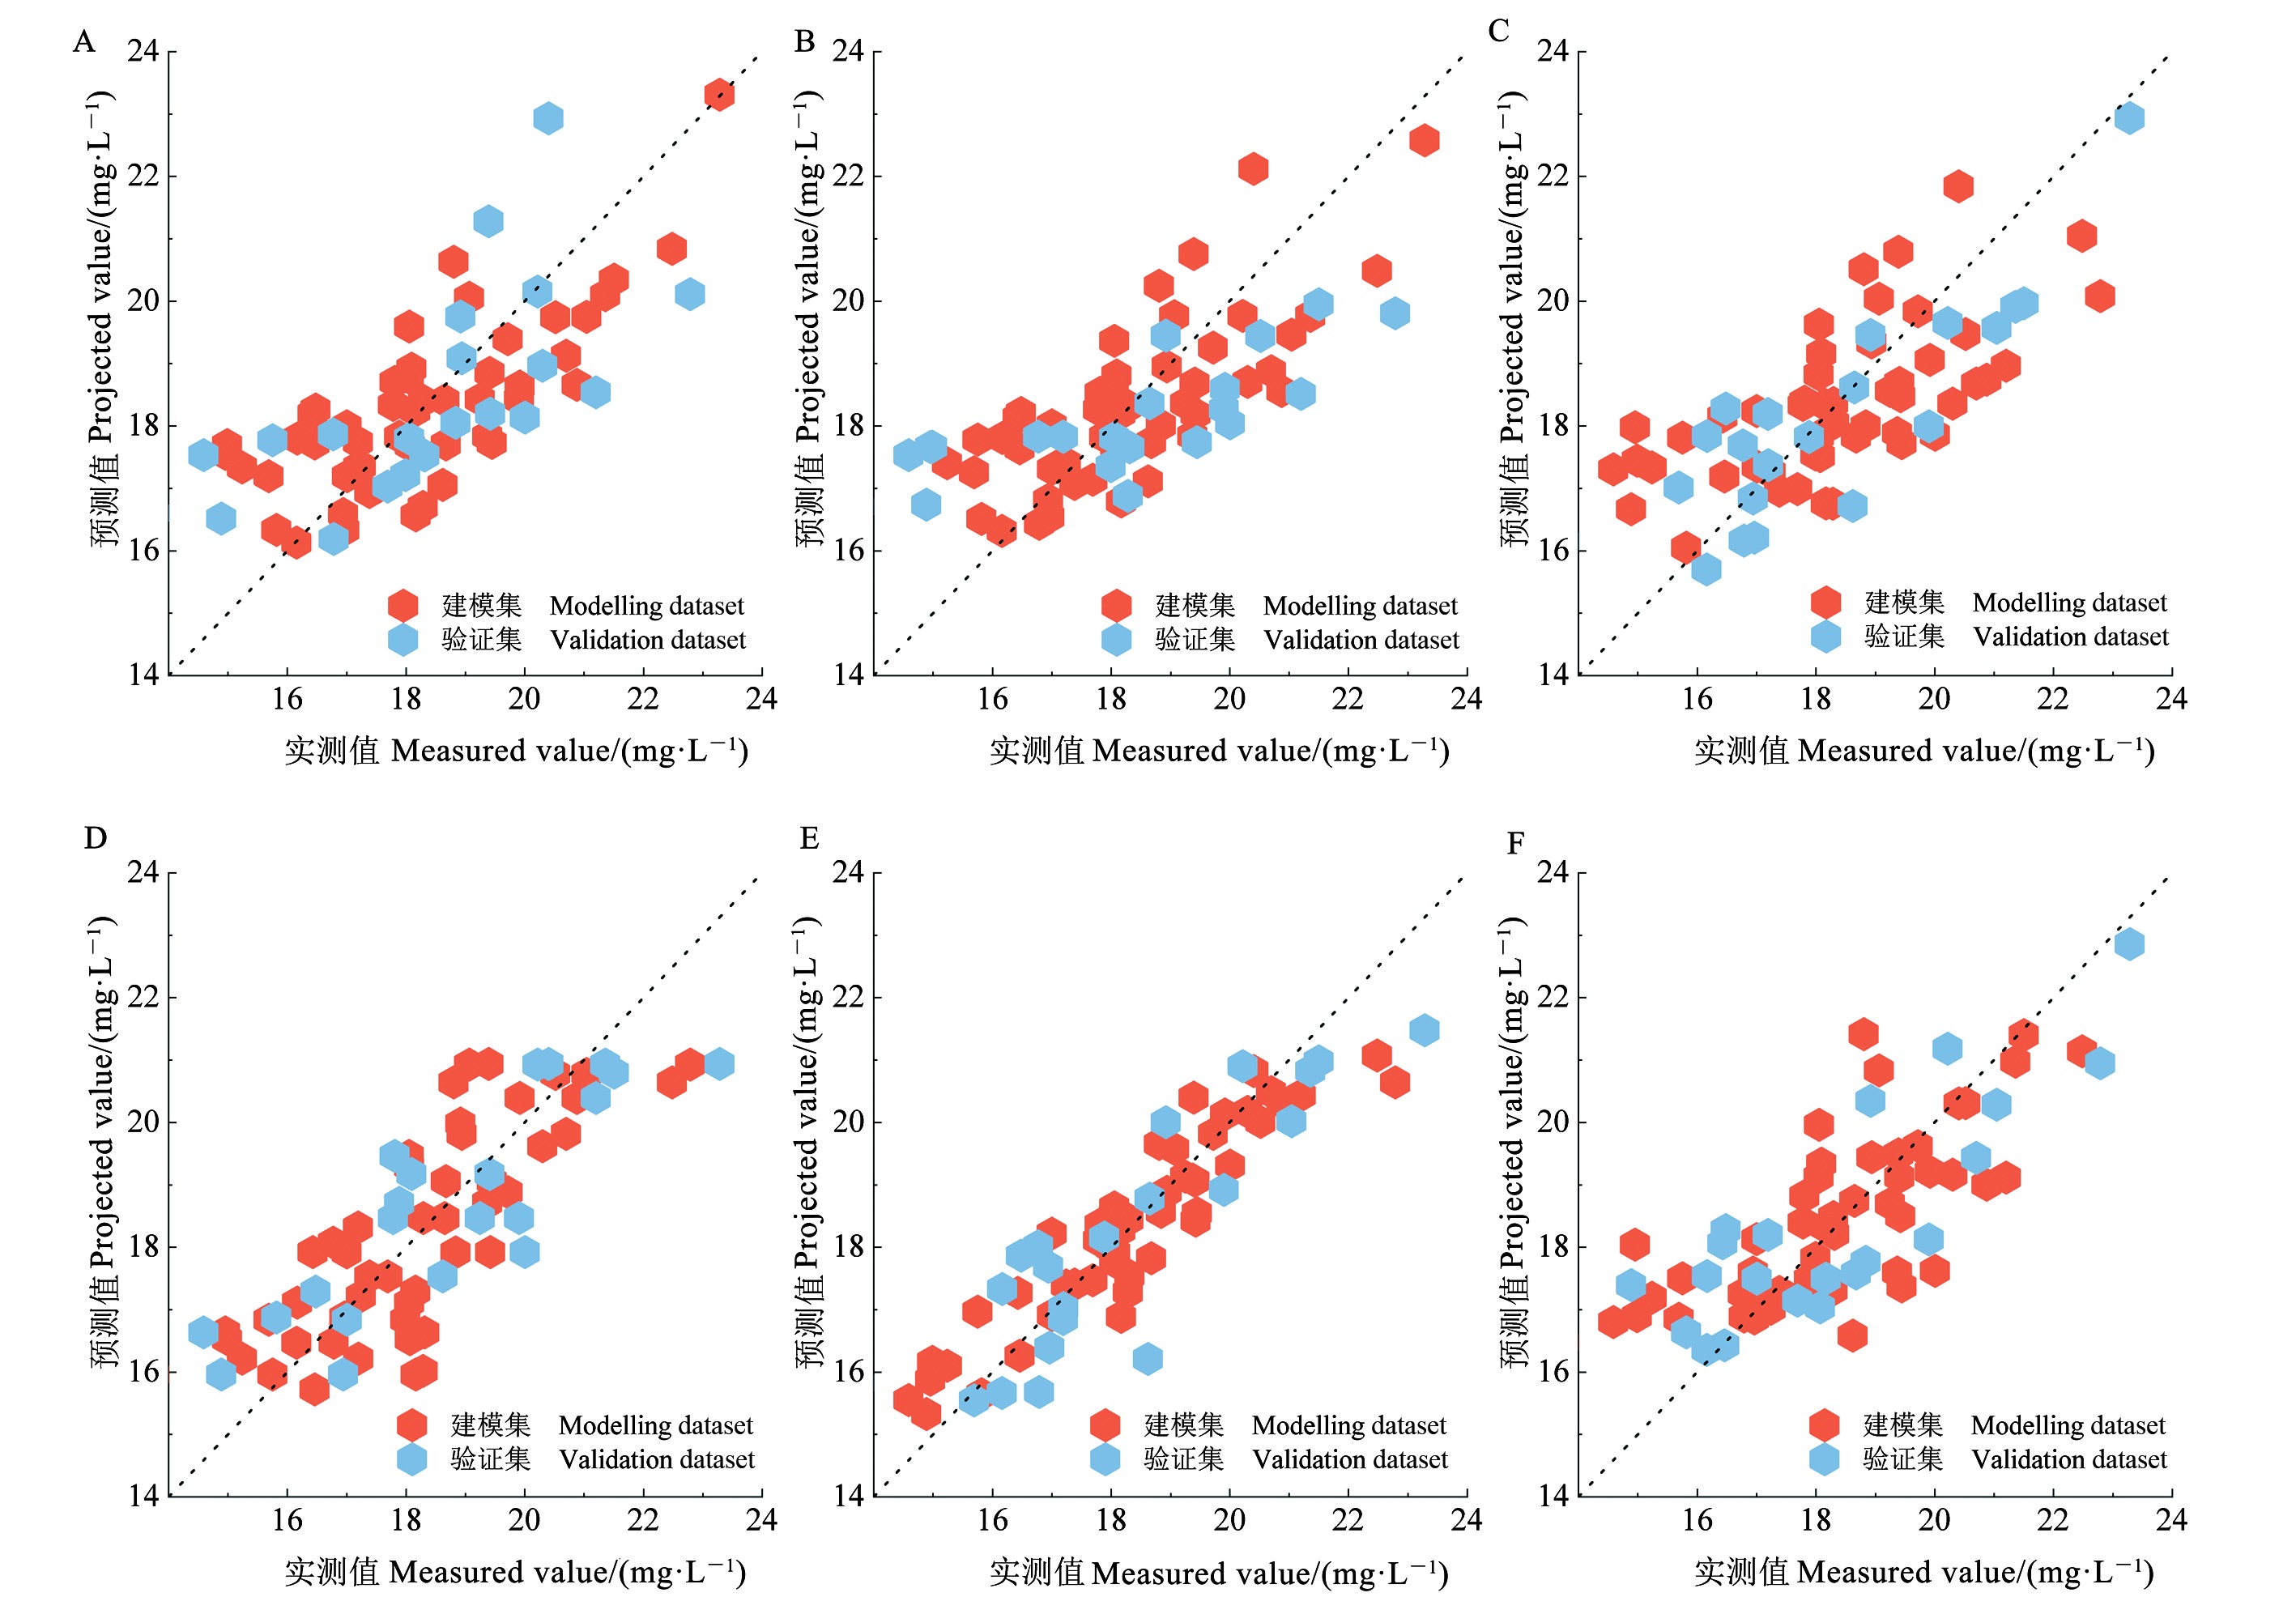
Fig. 3
Distribution of measured cholorophyll content and the predicted chlorophyll content value from machine learning regression model
A-F are methods based on LASSO regression, RR, PLSR, KNNR, RFR, and SVR, respectively.
Table 6
Estimation results of machine learning regression
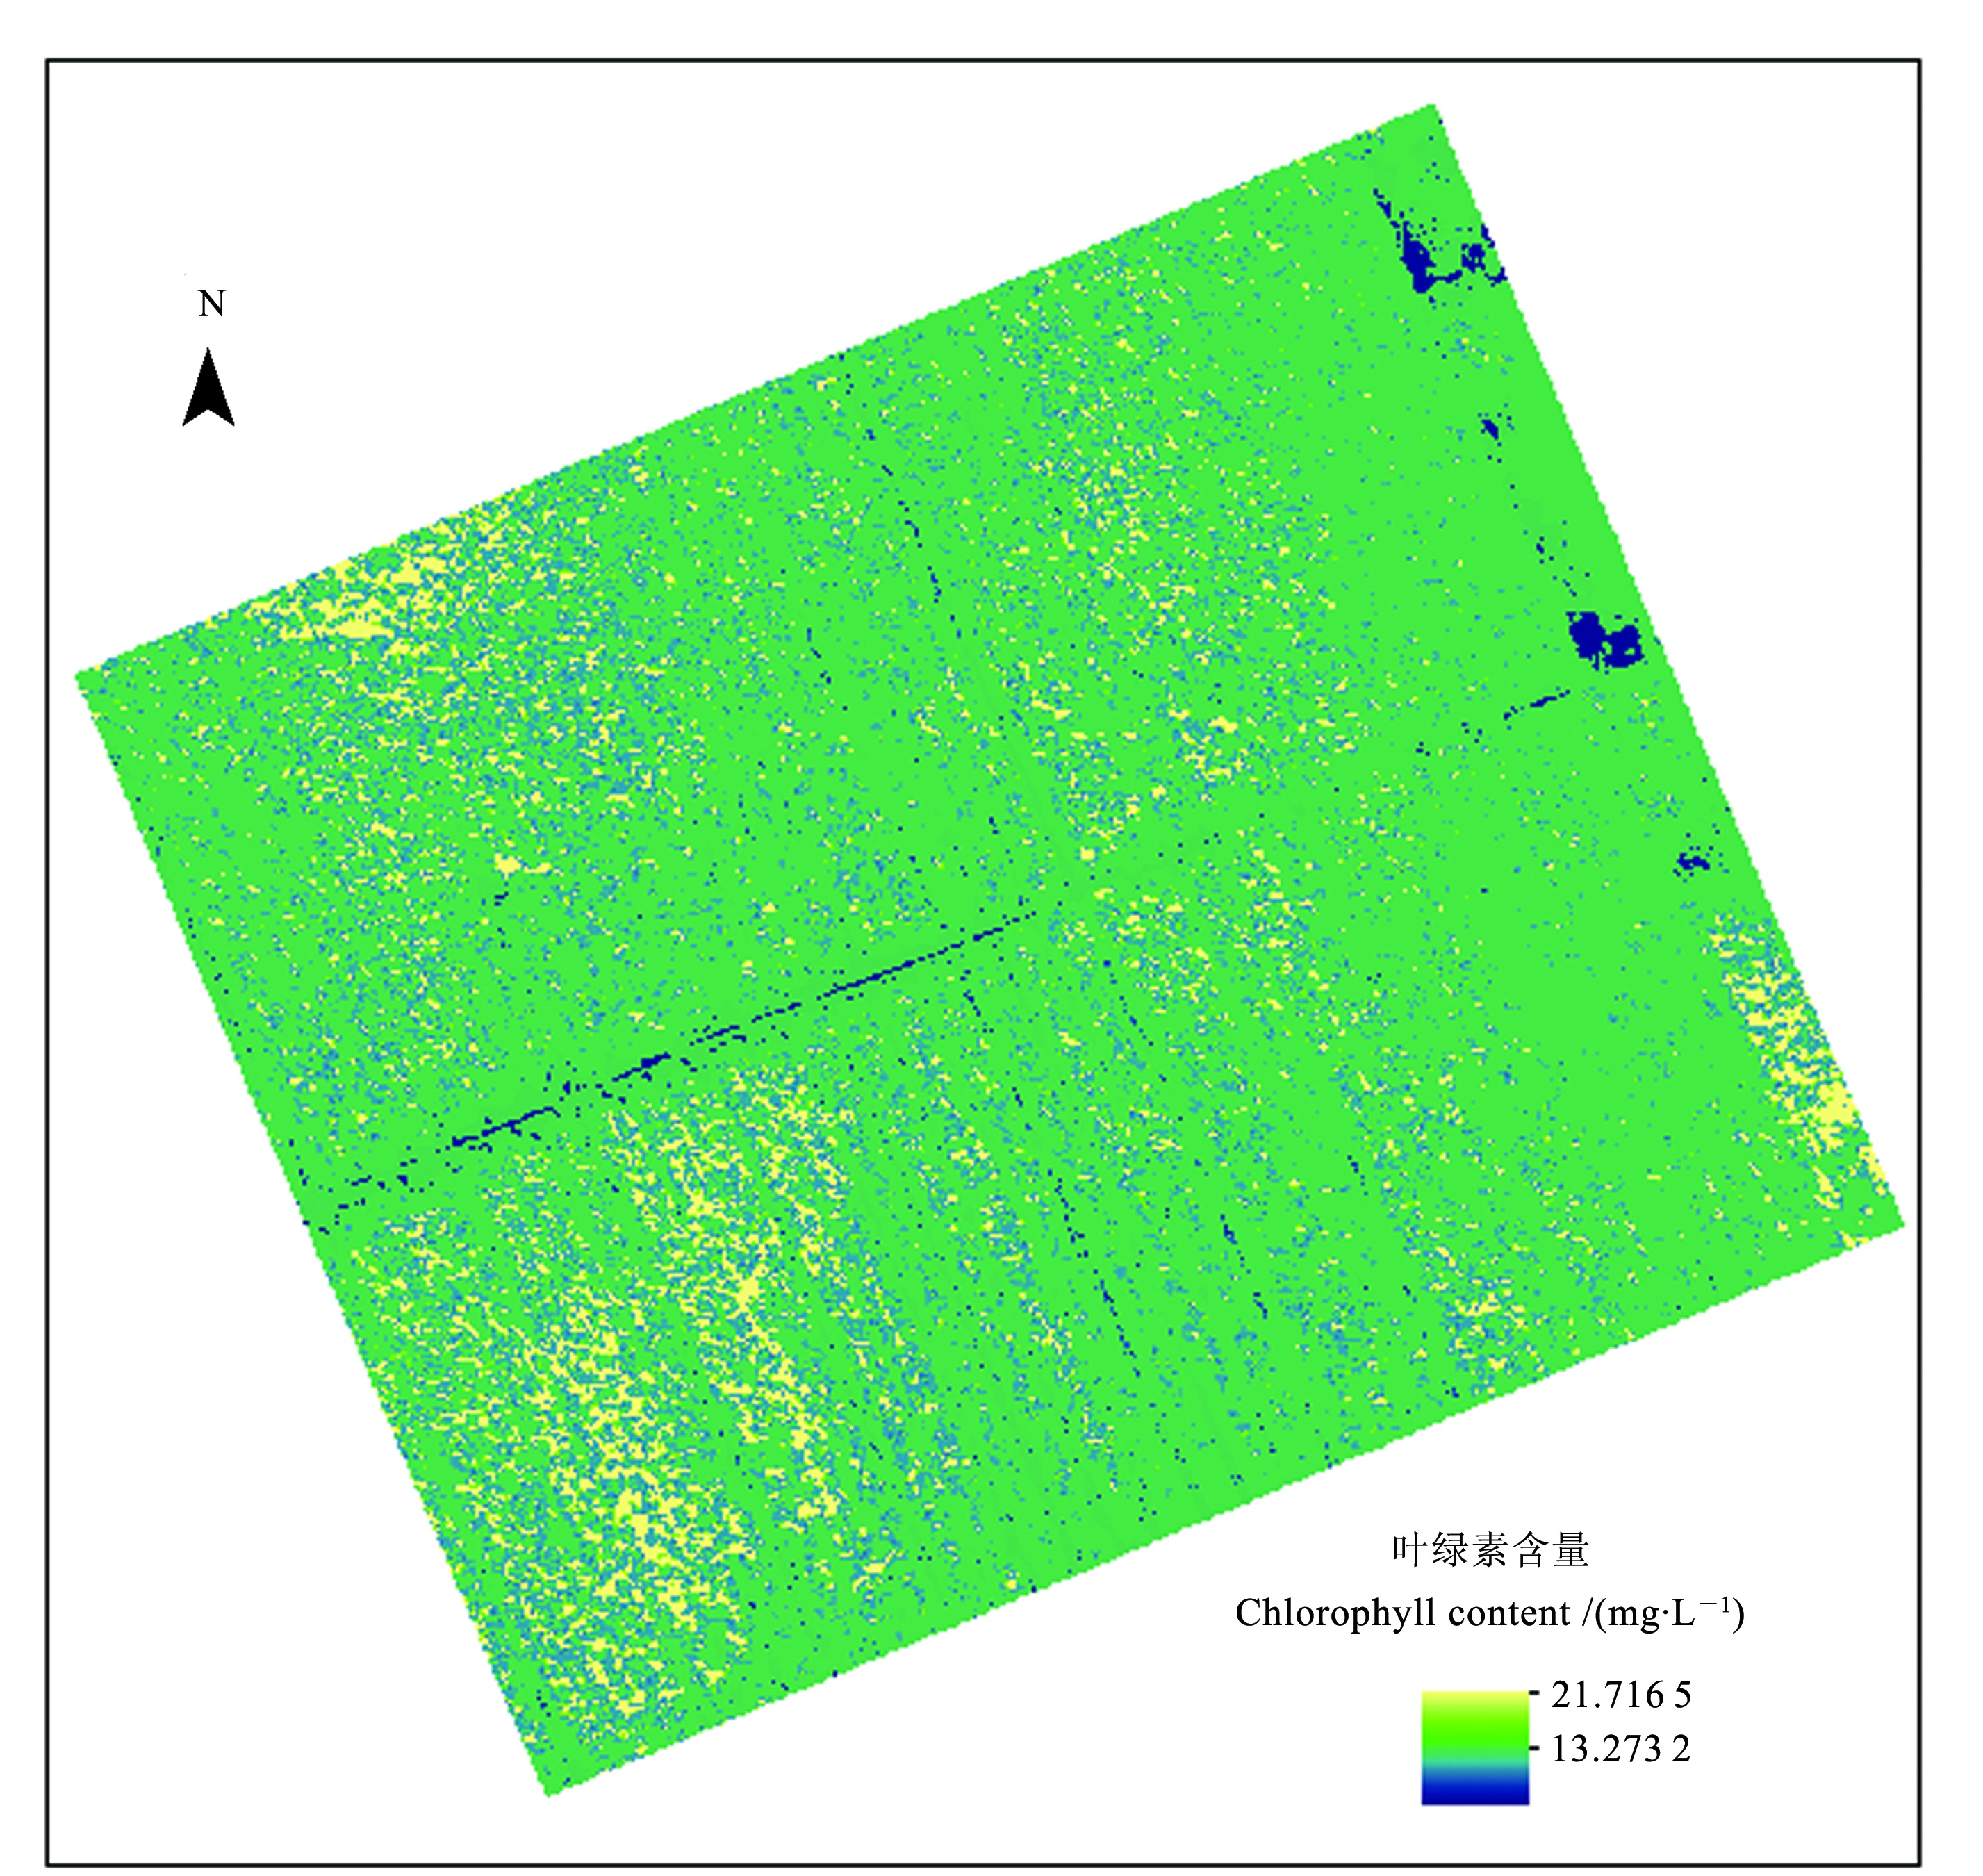
Fig. 4
Inversion mapping of cotton canopy chlorophyll content using the RFR model