×
模态框(Modal)标题
在这里添加一些文本
Close
Close
Submit
Cancel
Confirm
×
模态框(Modal)标题
×
Toggle navigation
Home
About
About Journal
Editor-in-Chief
Editorial Board
Awards and Honors
Indexed In
Impact Factor
Instruction
Instruction for Authors
Fees
Online Submission
Journal Online
Just Accepted
Current Issue
Archive
Most Read
Most Download
Most Cited
E-mail Alert
RSS
Specification
Paper Structure/Writing
Word Standardization
Unit of Measurement
Punctuation
Typographic Format/Template
Reference Format
Subscription
Advertising Service
Advertising Notice
Advertising Fee
Contact Us
中文
China Cotton
Figure/Table detail
Effects of spent mushroom substrate on cotton Verticillium wilt and the cotton rhizosphere microbiome
Qu Yuanhang, Liu Tiancong, Lu Xiuyun, Li Shezeng, Guo Qinggang, Ma Ping
Cotton Science
, 2023, 35(
4
): 274-287. DOI:
10.11963/cs20220039
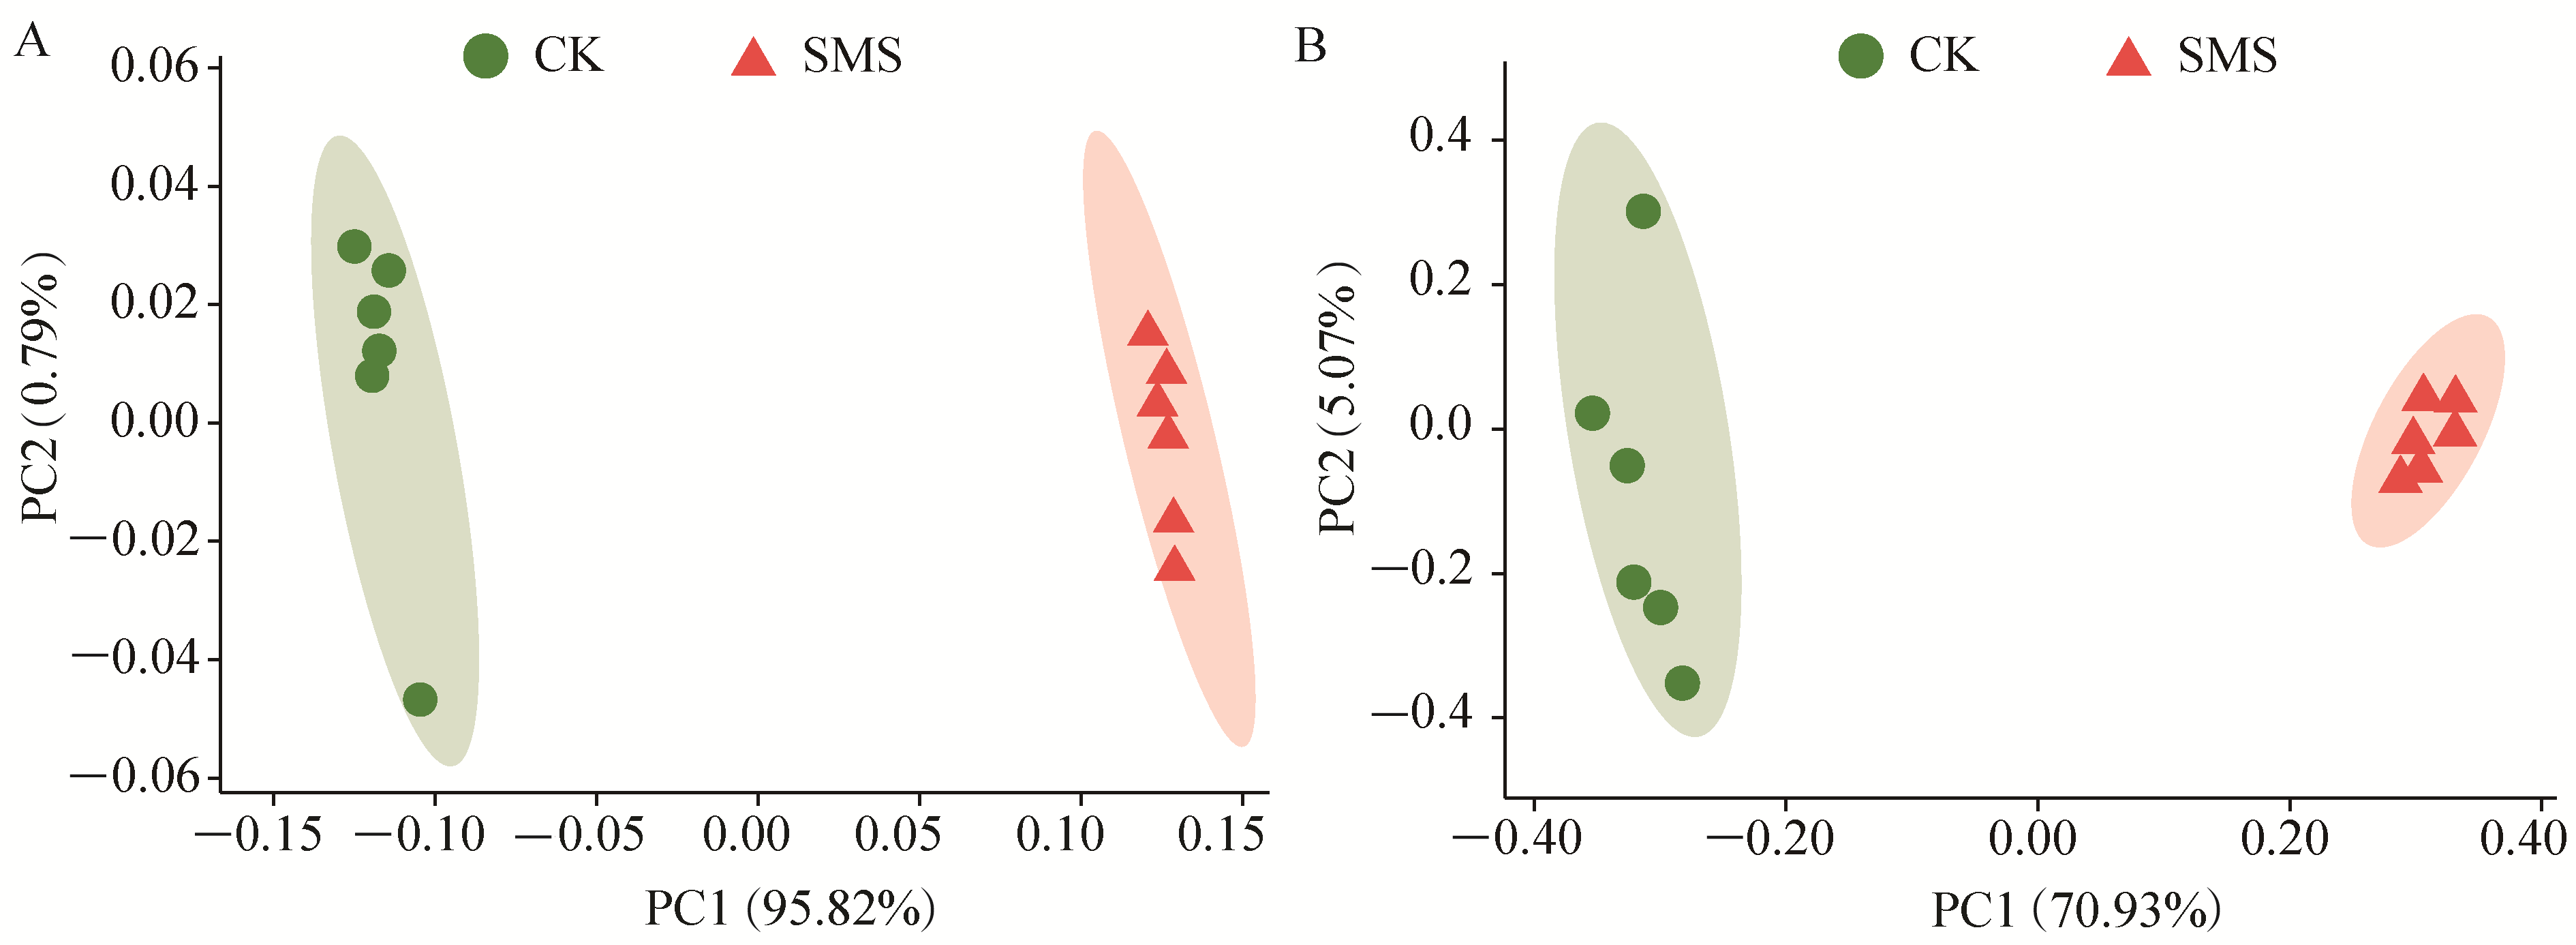
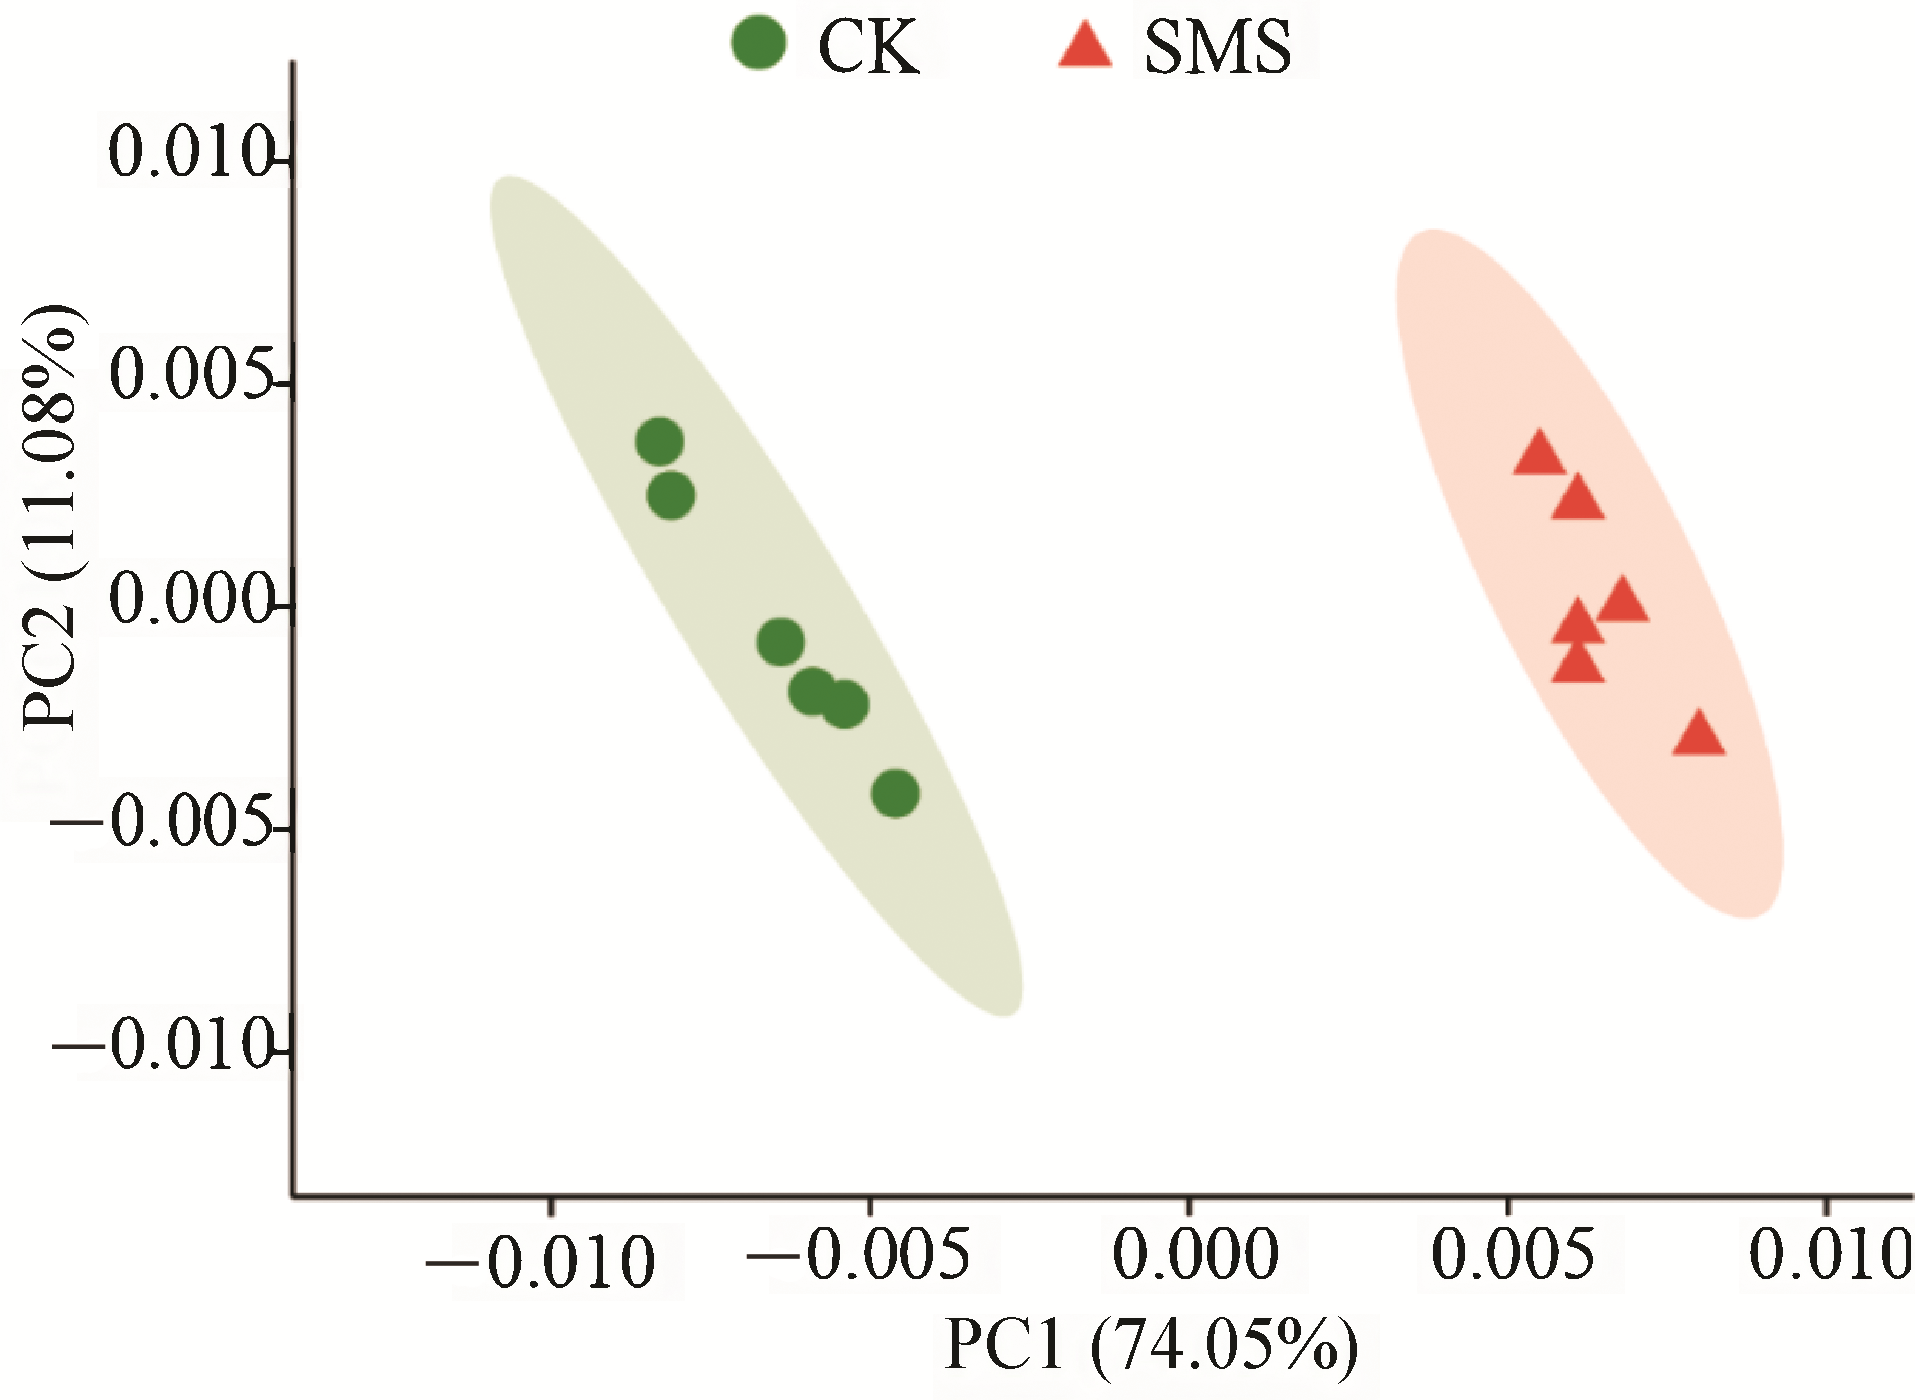
Fig. 3
PCoA of bacterial (A) and fungal (B) community at OTU level
CK: blank control; SMS: spent mushroom substrate treatment.
Other figure/table from this article
Table 1
Effects of spent mushroom substrate treatment on microsclerotia formation and mycelium growth of
V. dahliae
Fig. 1
Effect of 2% spent mushroom substrate (SMS) treatment on control effect (A) and disease index (B) of cotton Verticillium wilt
CK: blank control. Four asterisks represent extremely significant differences at the 0.001 probability level between treatments (
P
< 0.001).
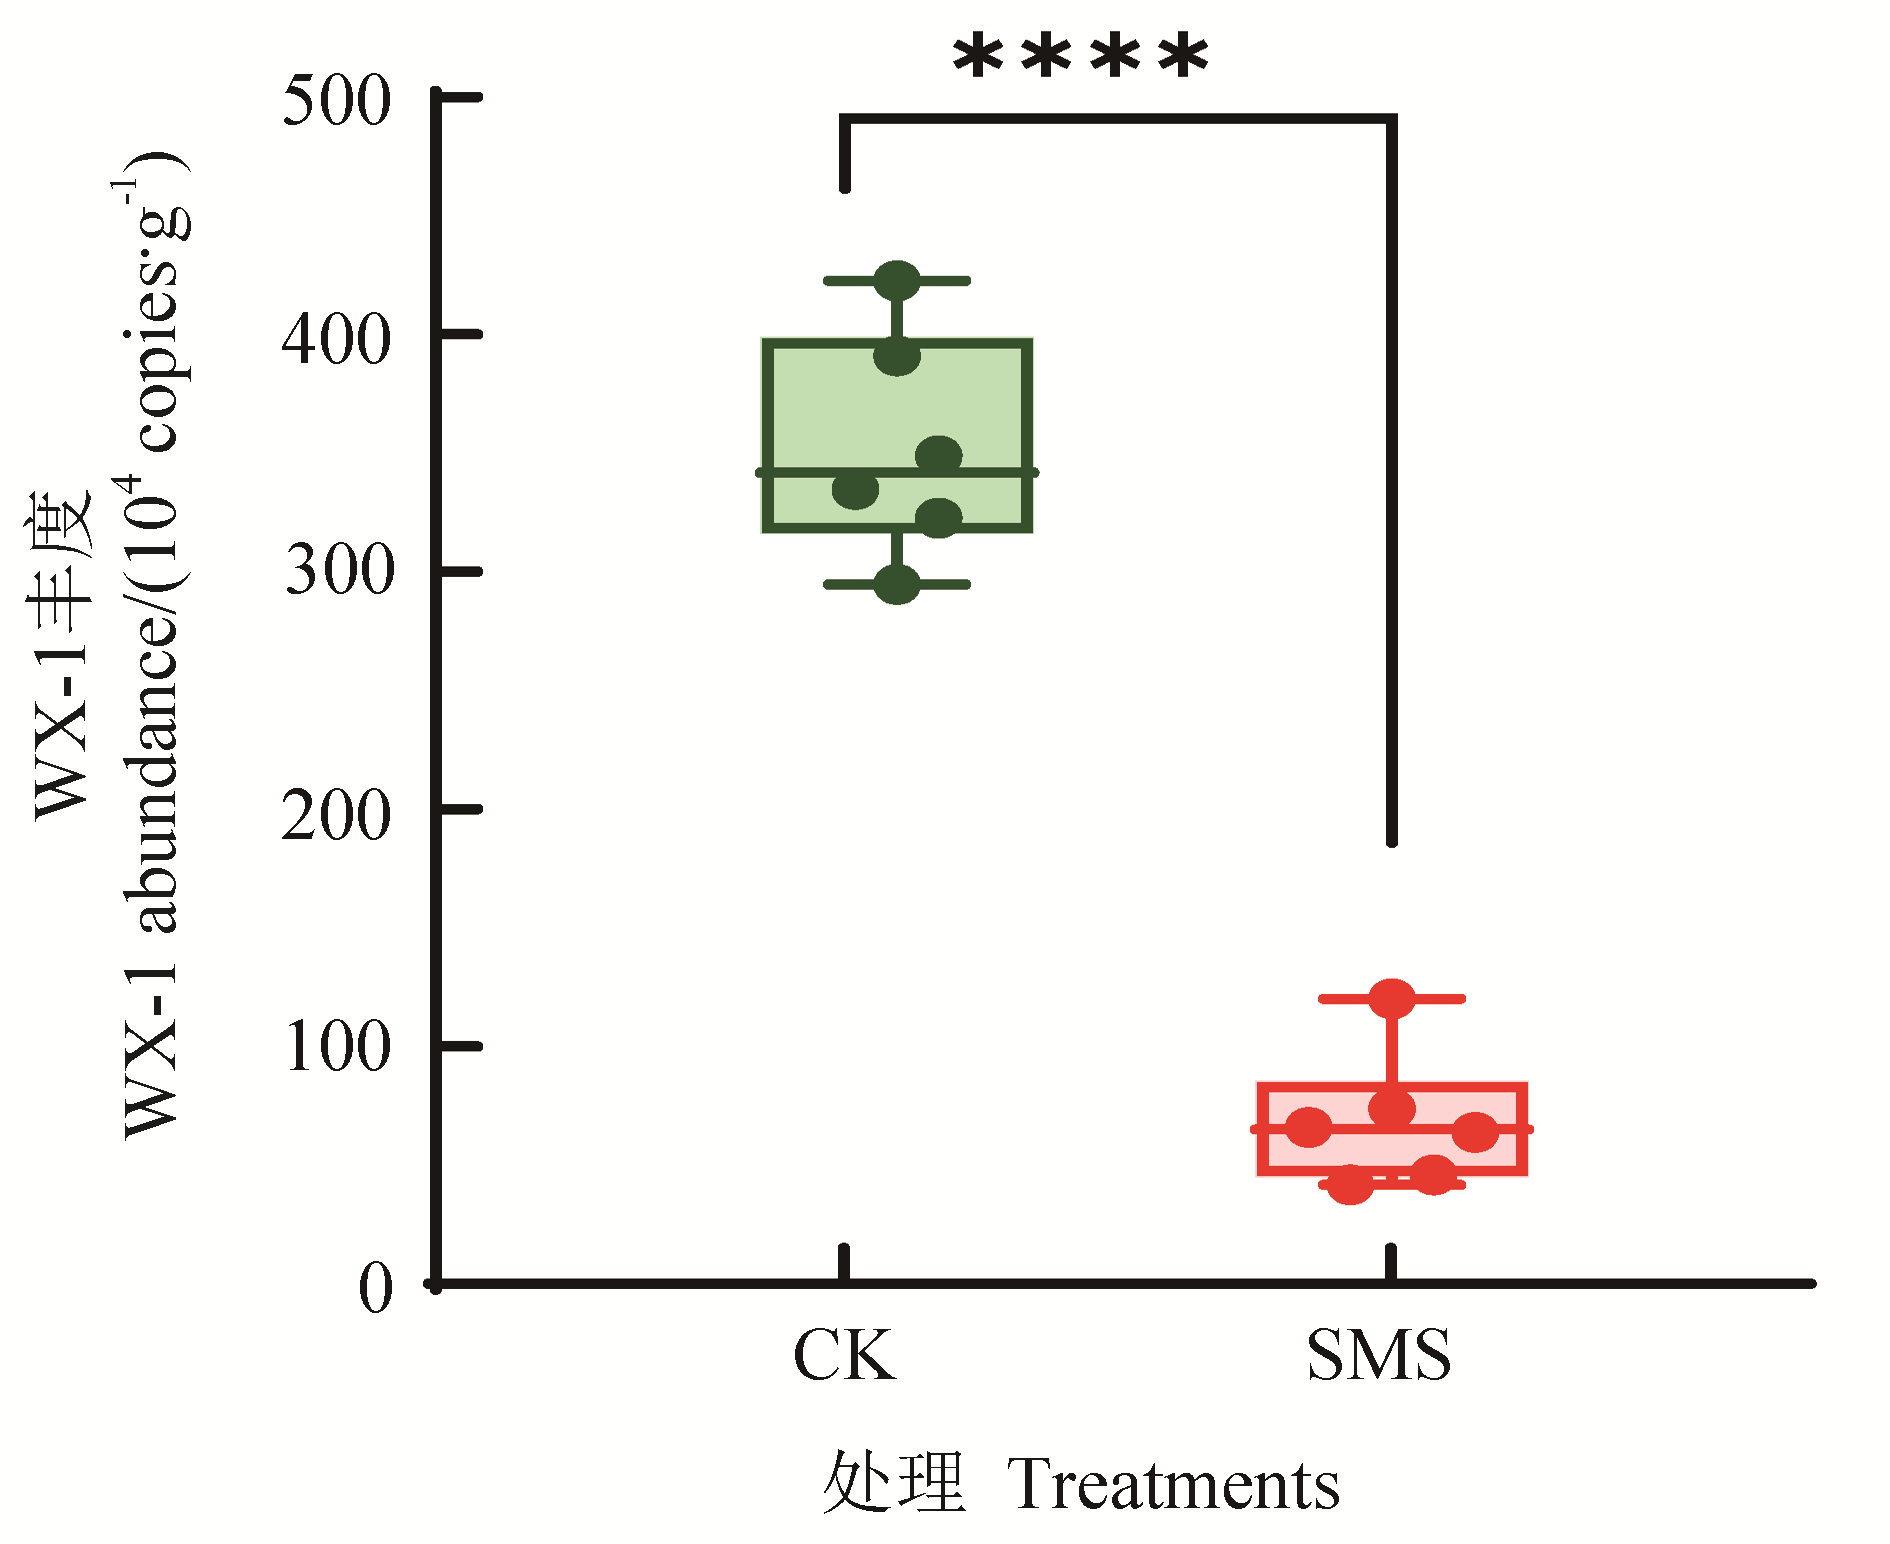
Fig. 2
Effect of 2% spent mushroom substrate (SMS) treatment on WX-1 population in the cotton rhizosphere
CK: blank control. Four asterisks represent extremely significant differences at the 0.001 probability level between treatments (
P
< 0.001).
Table 2
Statistics of rhizosphere soil genomic DNA sequencing data
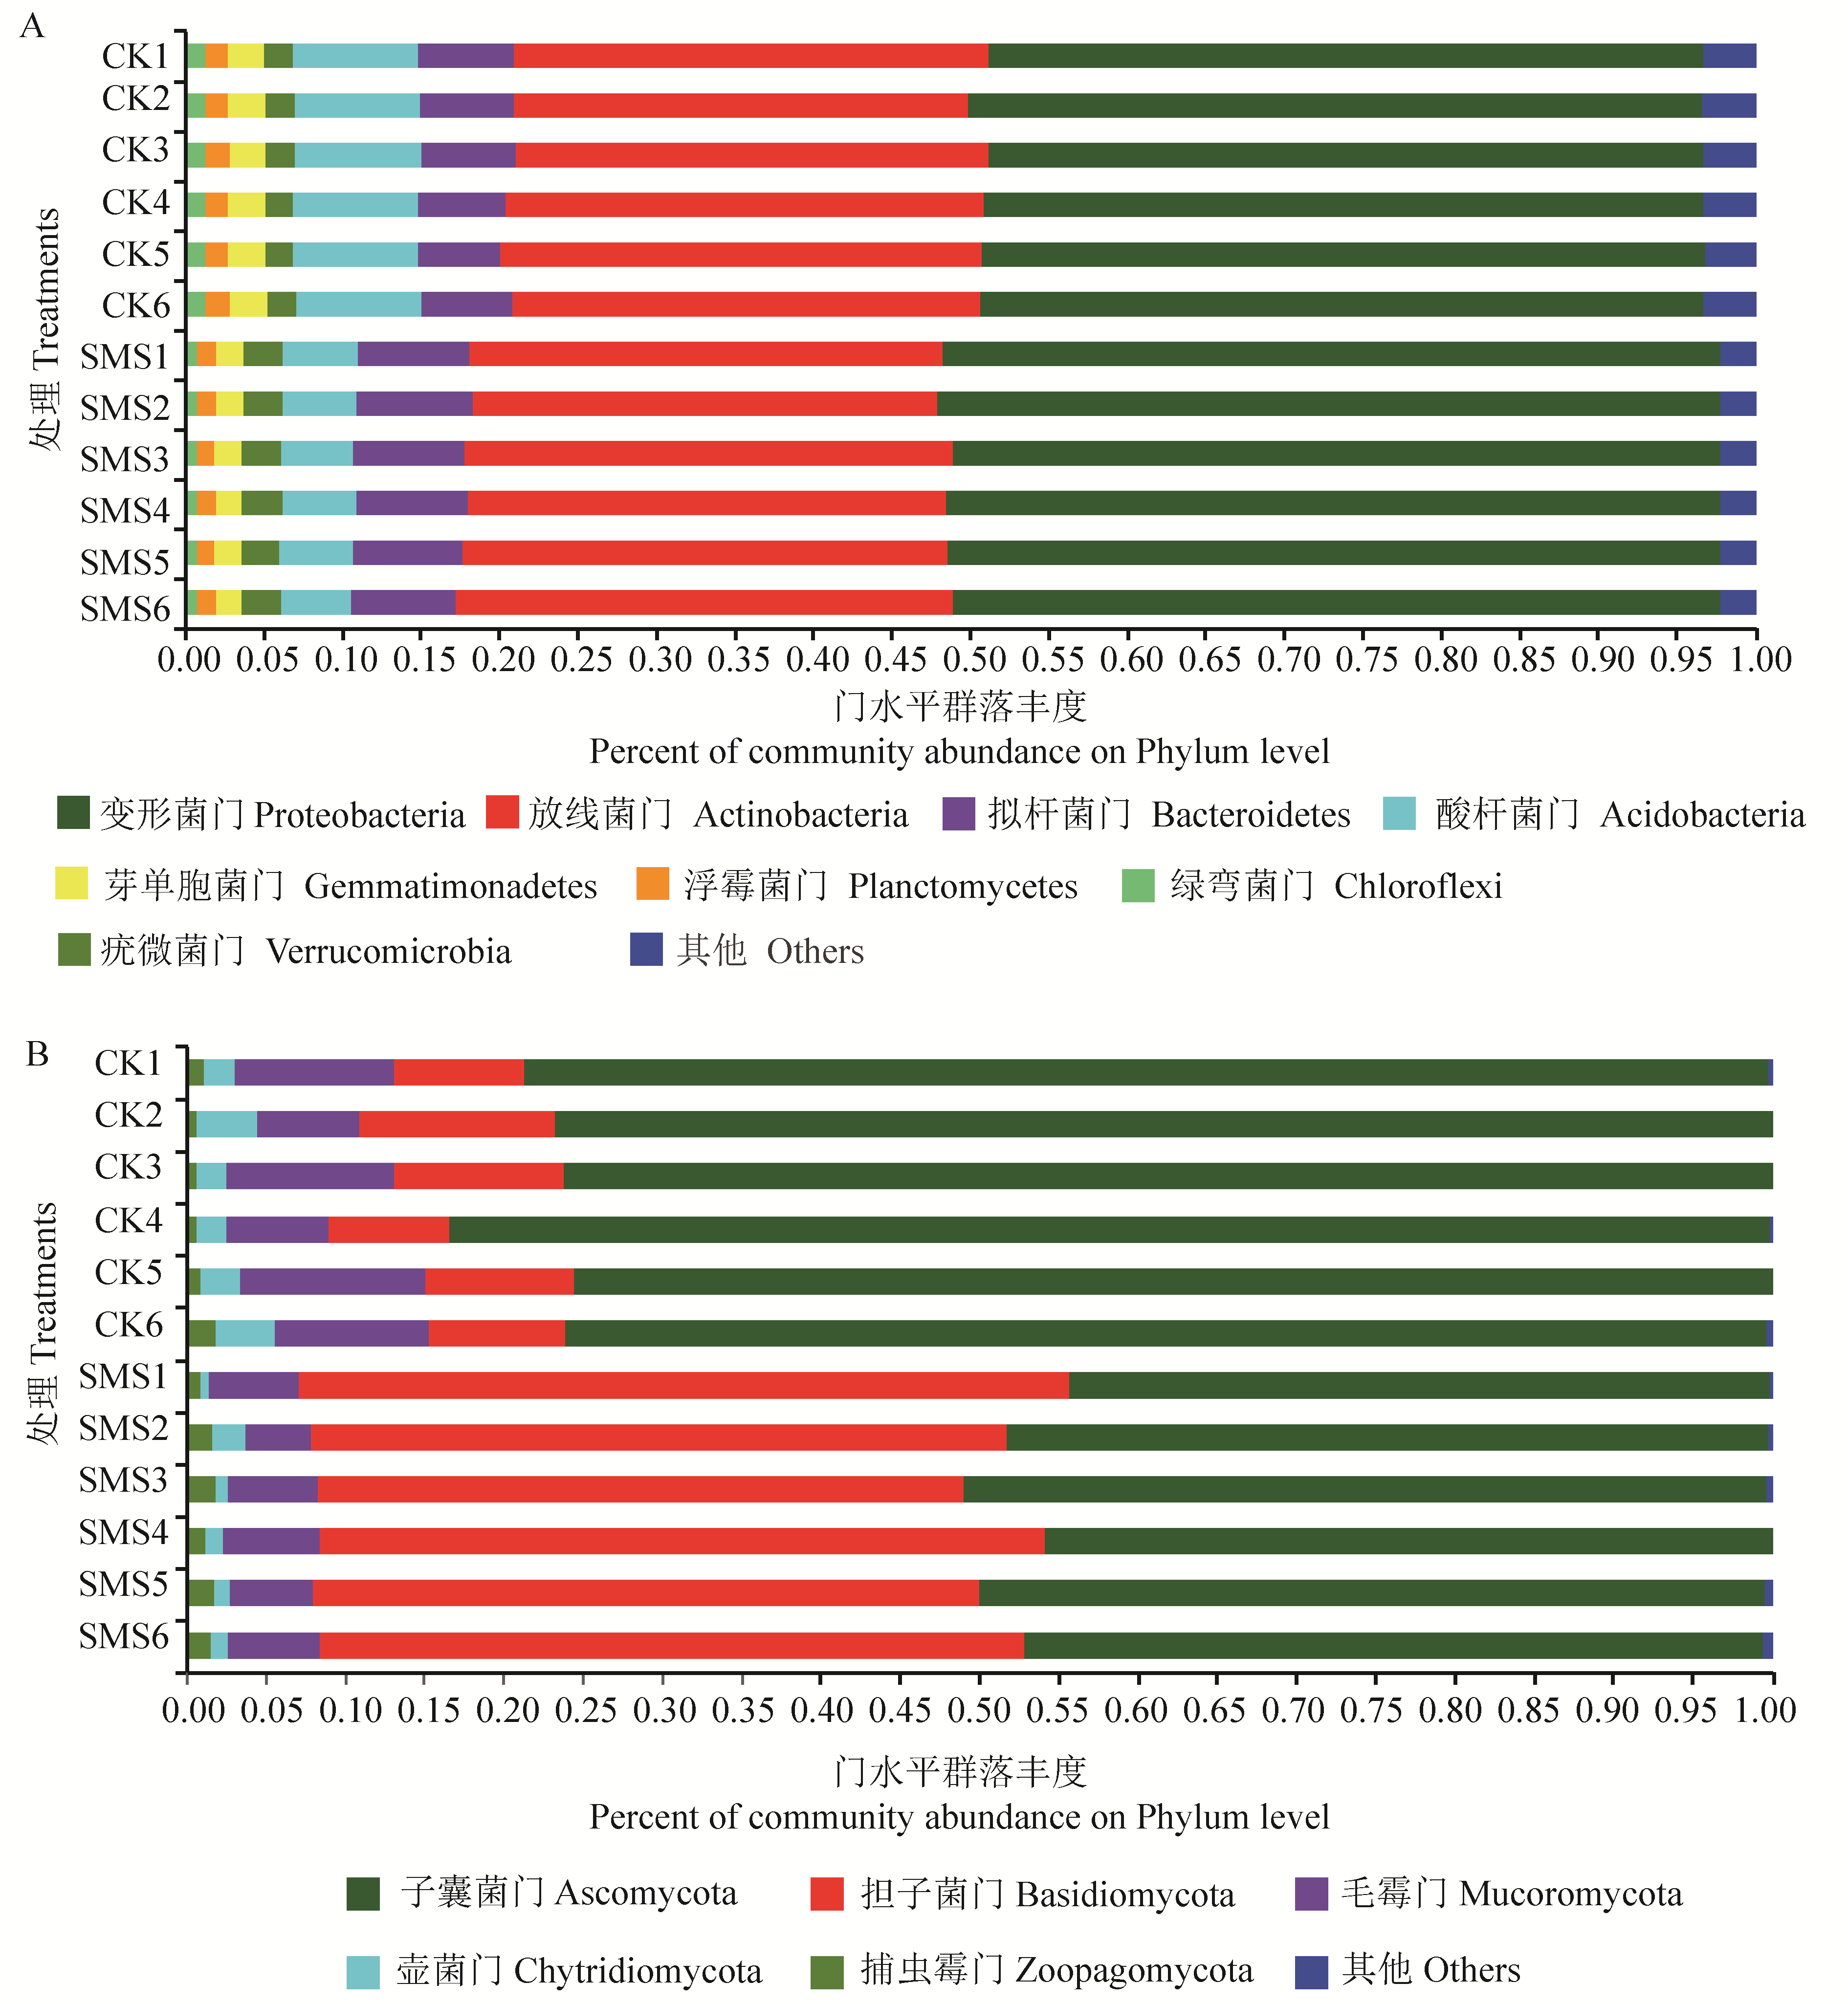
Fig. 4
Cotton rhizosphere bacterial (A) and fungal (B) community composition on Phylum level
CK: blank control; SMS: spent mushroom substrate treatment.
Table 3
Bacterial and fungal taxa with relative abundance above 1% of rhizosphere soil
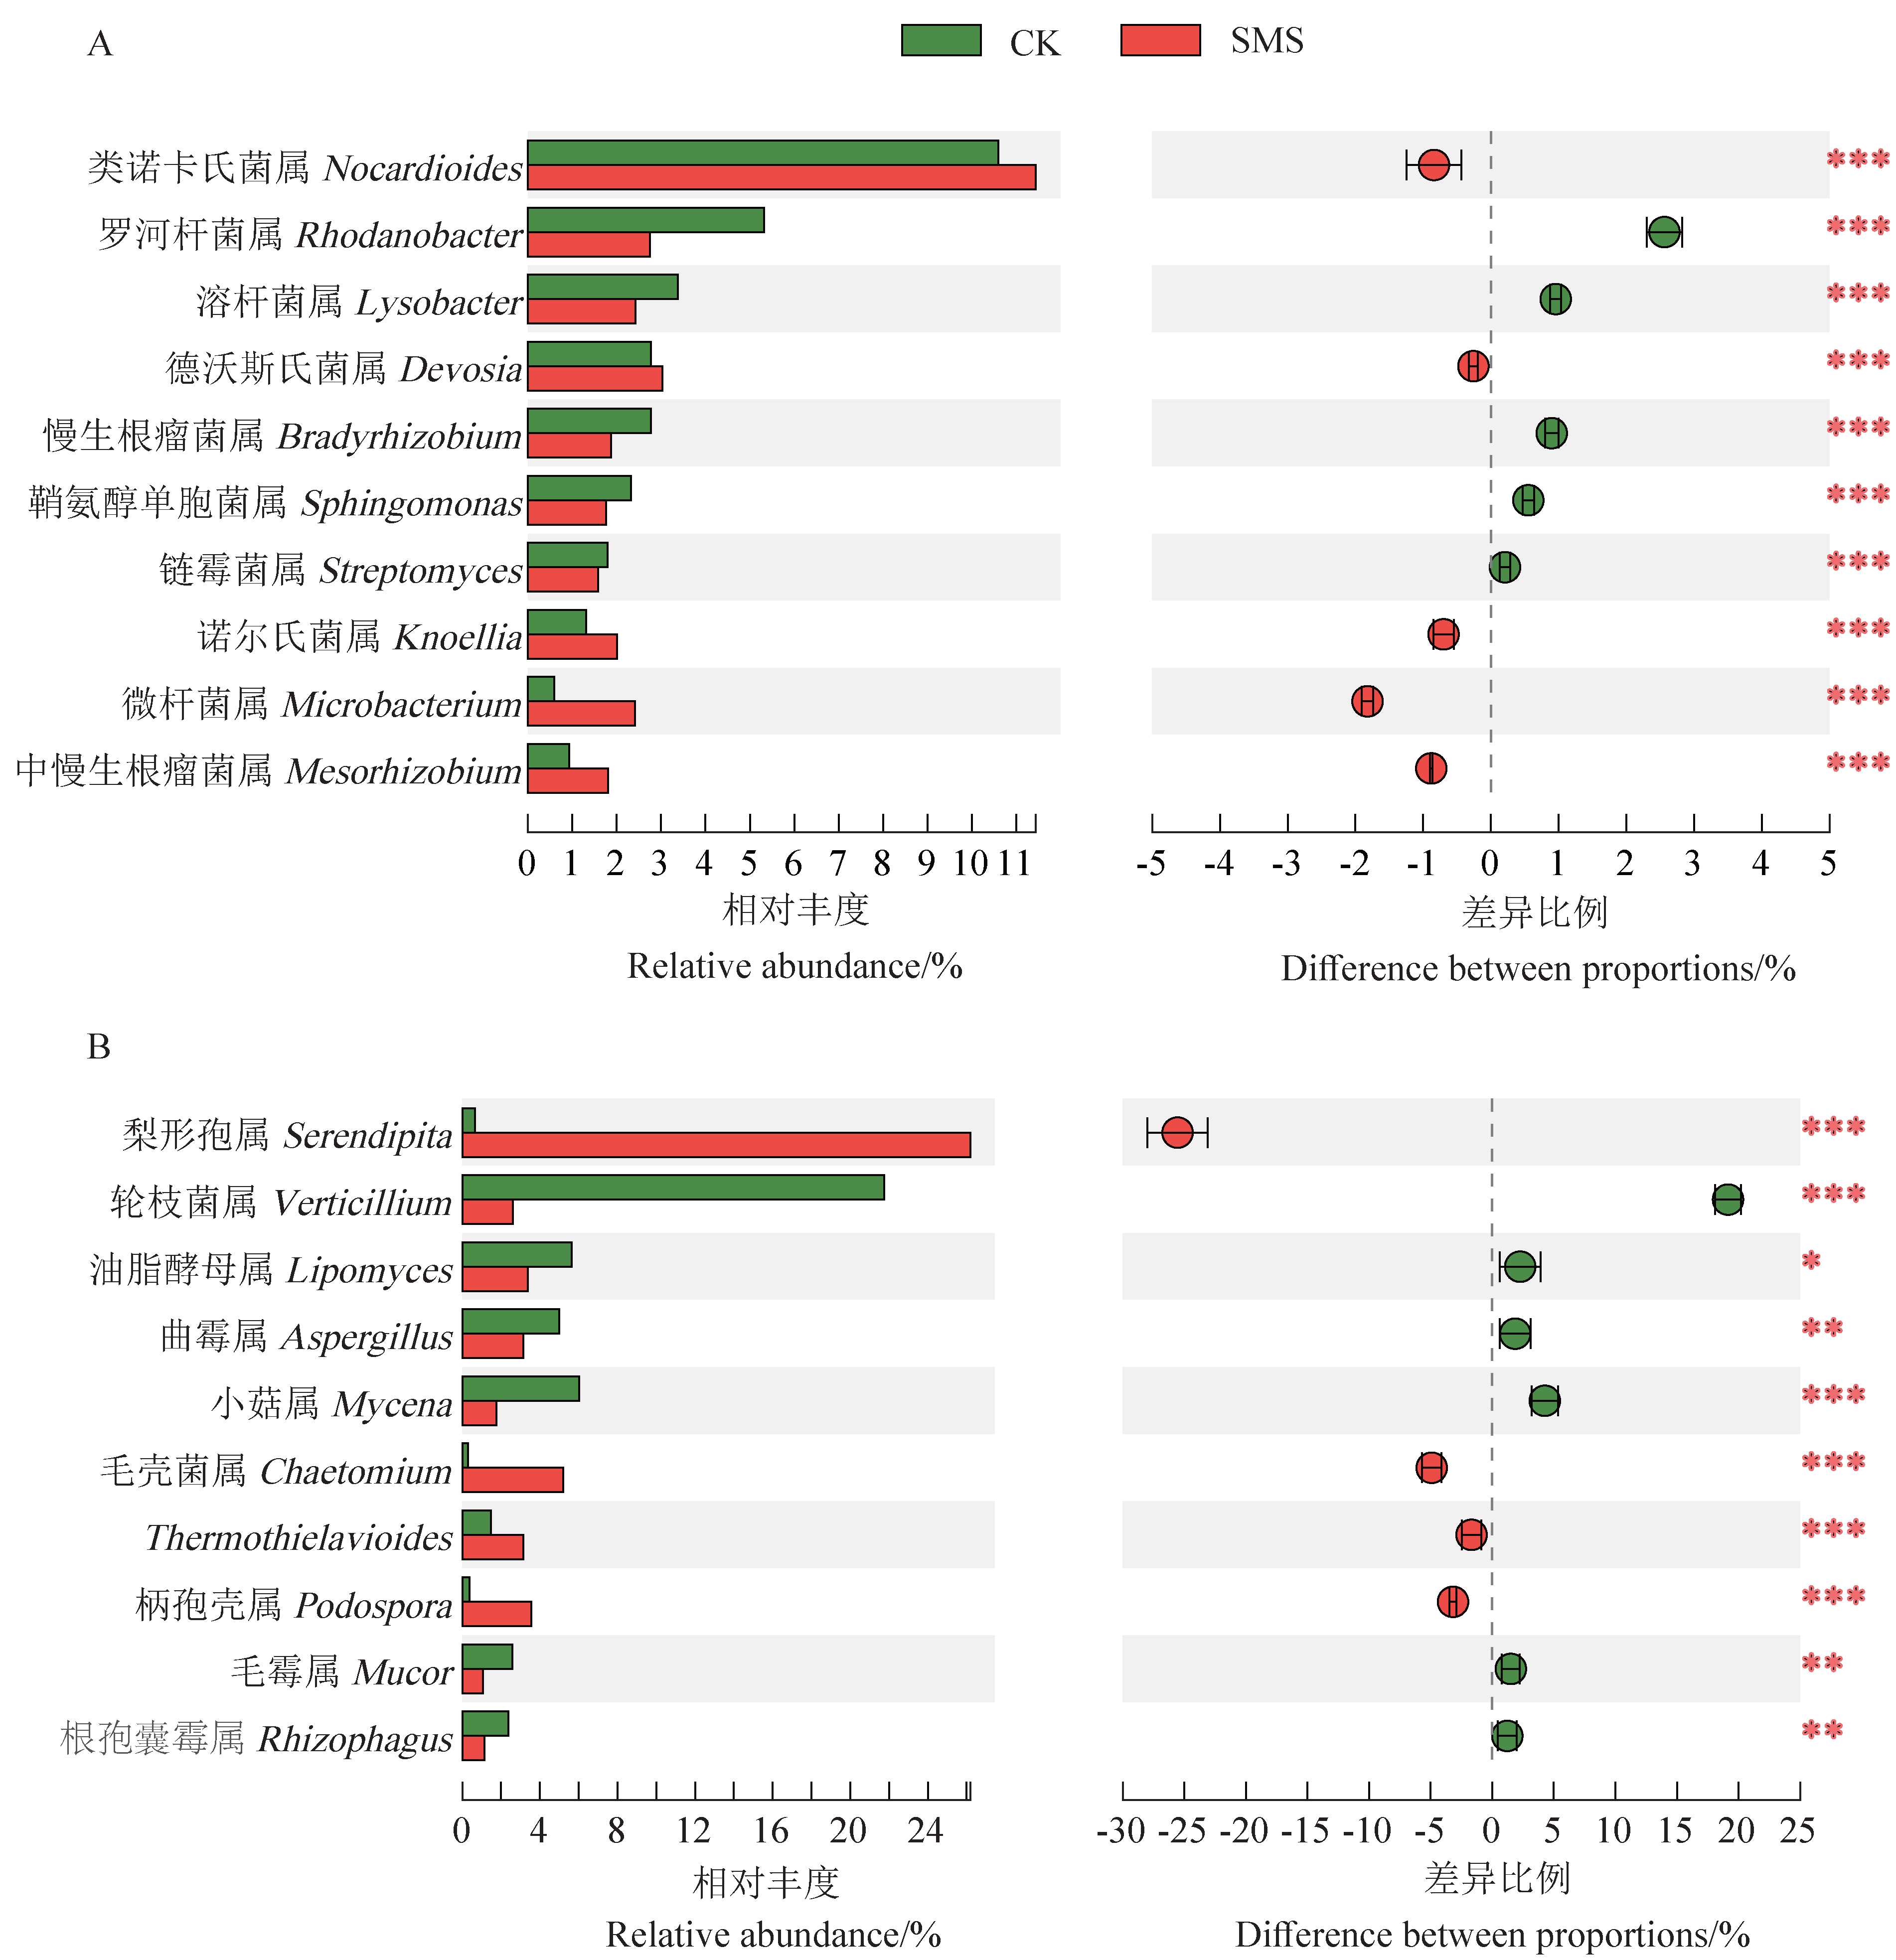
Fig. 5
Difference analysis at genus level of cotton rhizosphere bacteria (A) and fungi (B)
Green represents blank control, and red represents spent mushroom substrate (SMS) treatment. The asterisk indicates a significant difference, one represents
P
< 0.05, two represents
P
< 0.01, three represents
P
< 0.001. The red circle represents the genus enriched in the SMS, and the green circle represents the genus enriched in the blank control.
Fig. 6
Rhizosphere microbial co-occurrence networks under different treatments
Rhizosphere bacterial co-occurrence networks: blank control (A), spent mushroom substrate (SMS) (B) treatments; rhizosphere fungal co-occurrence networks: blank control (C), SMS (D) treatments. Network nodes are colored by the phylum, node size is proportional to the number of connections (degree), and the thickness of each connection (edge) between two nodes is proportional to the correlation coefficient value, with red edges representing positive correlation and green edges representing negative correlation.
Table 4
Topology properties of the co-occurrence networks
Fig. 7
Principal co-ordinates analysis of KEGG pathway
CK: blank control; SMS: spent mushroom substrate treatment.
Fig. 8
KEGG pathway analysis of rhizosphere microbiome functional gene
Green represents blank control, and red represents spent mushroom substrate (SMS) treatment. The asterisk indicates a significant difference, one represents
P
< 0.05, two represents
P
< 0.01, three represents
P
< 0.001. The red circle represents the pathway enriched in the SMS, and the green circle represents the pathway enriched in the blank control.
Table 5
Effect of SMS on cotton Verticillium wilt and yield