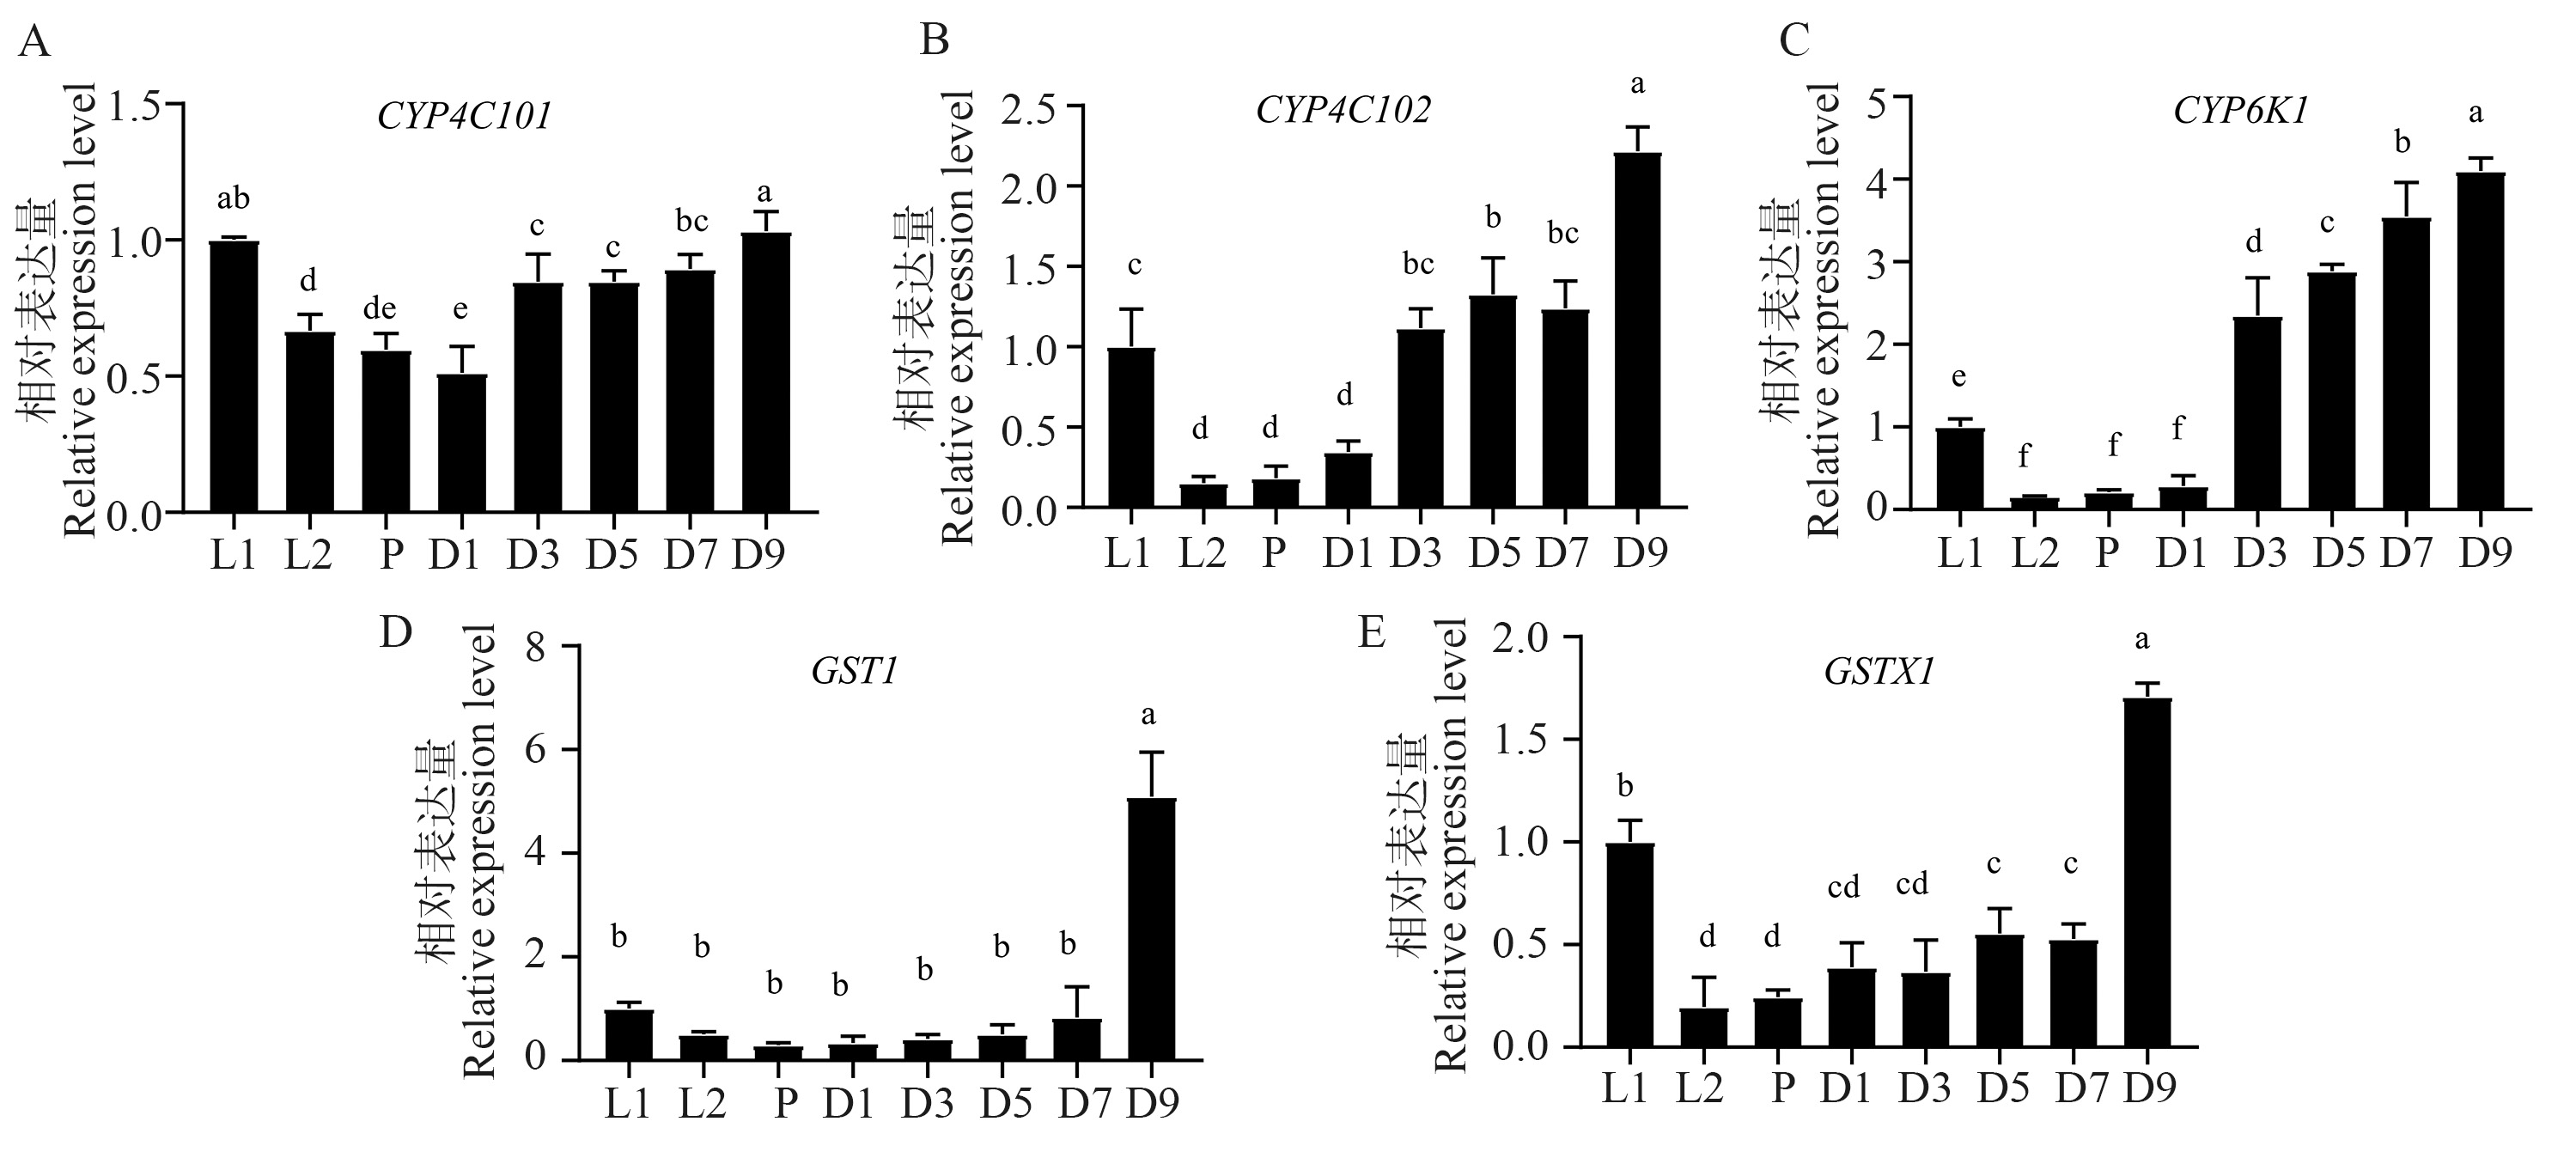
Fig. 2 The expression levels of CYP450 and GST genes at different developmental stages of T. tabaci L1 is the 1st instar of larvae; L2 is the 2nd instar of larvae; P is the pupal stage; D1, D3, D5, D7 and D9 are the 1st, 3rd, 5th, 7th and 9th day after adult emergence, respectively. Different lowercase letters indicate significant difference (P < 0.05).
Other figure/table from this article