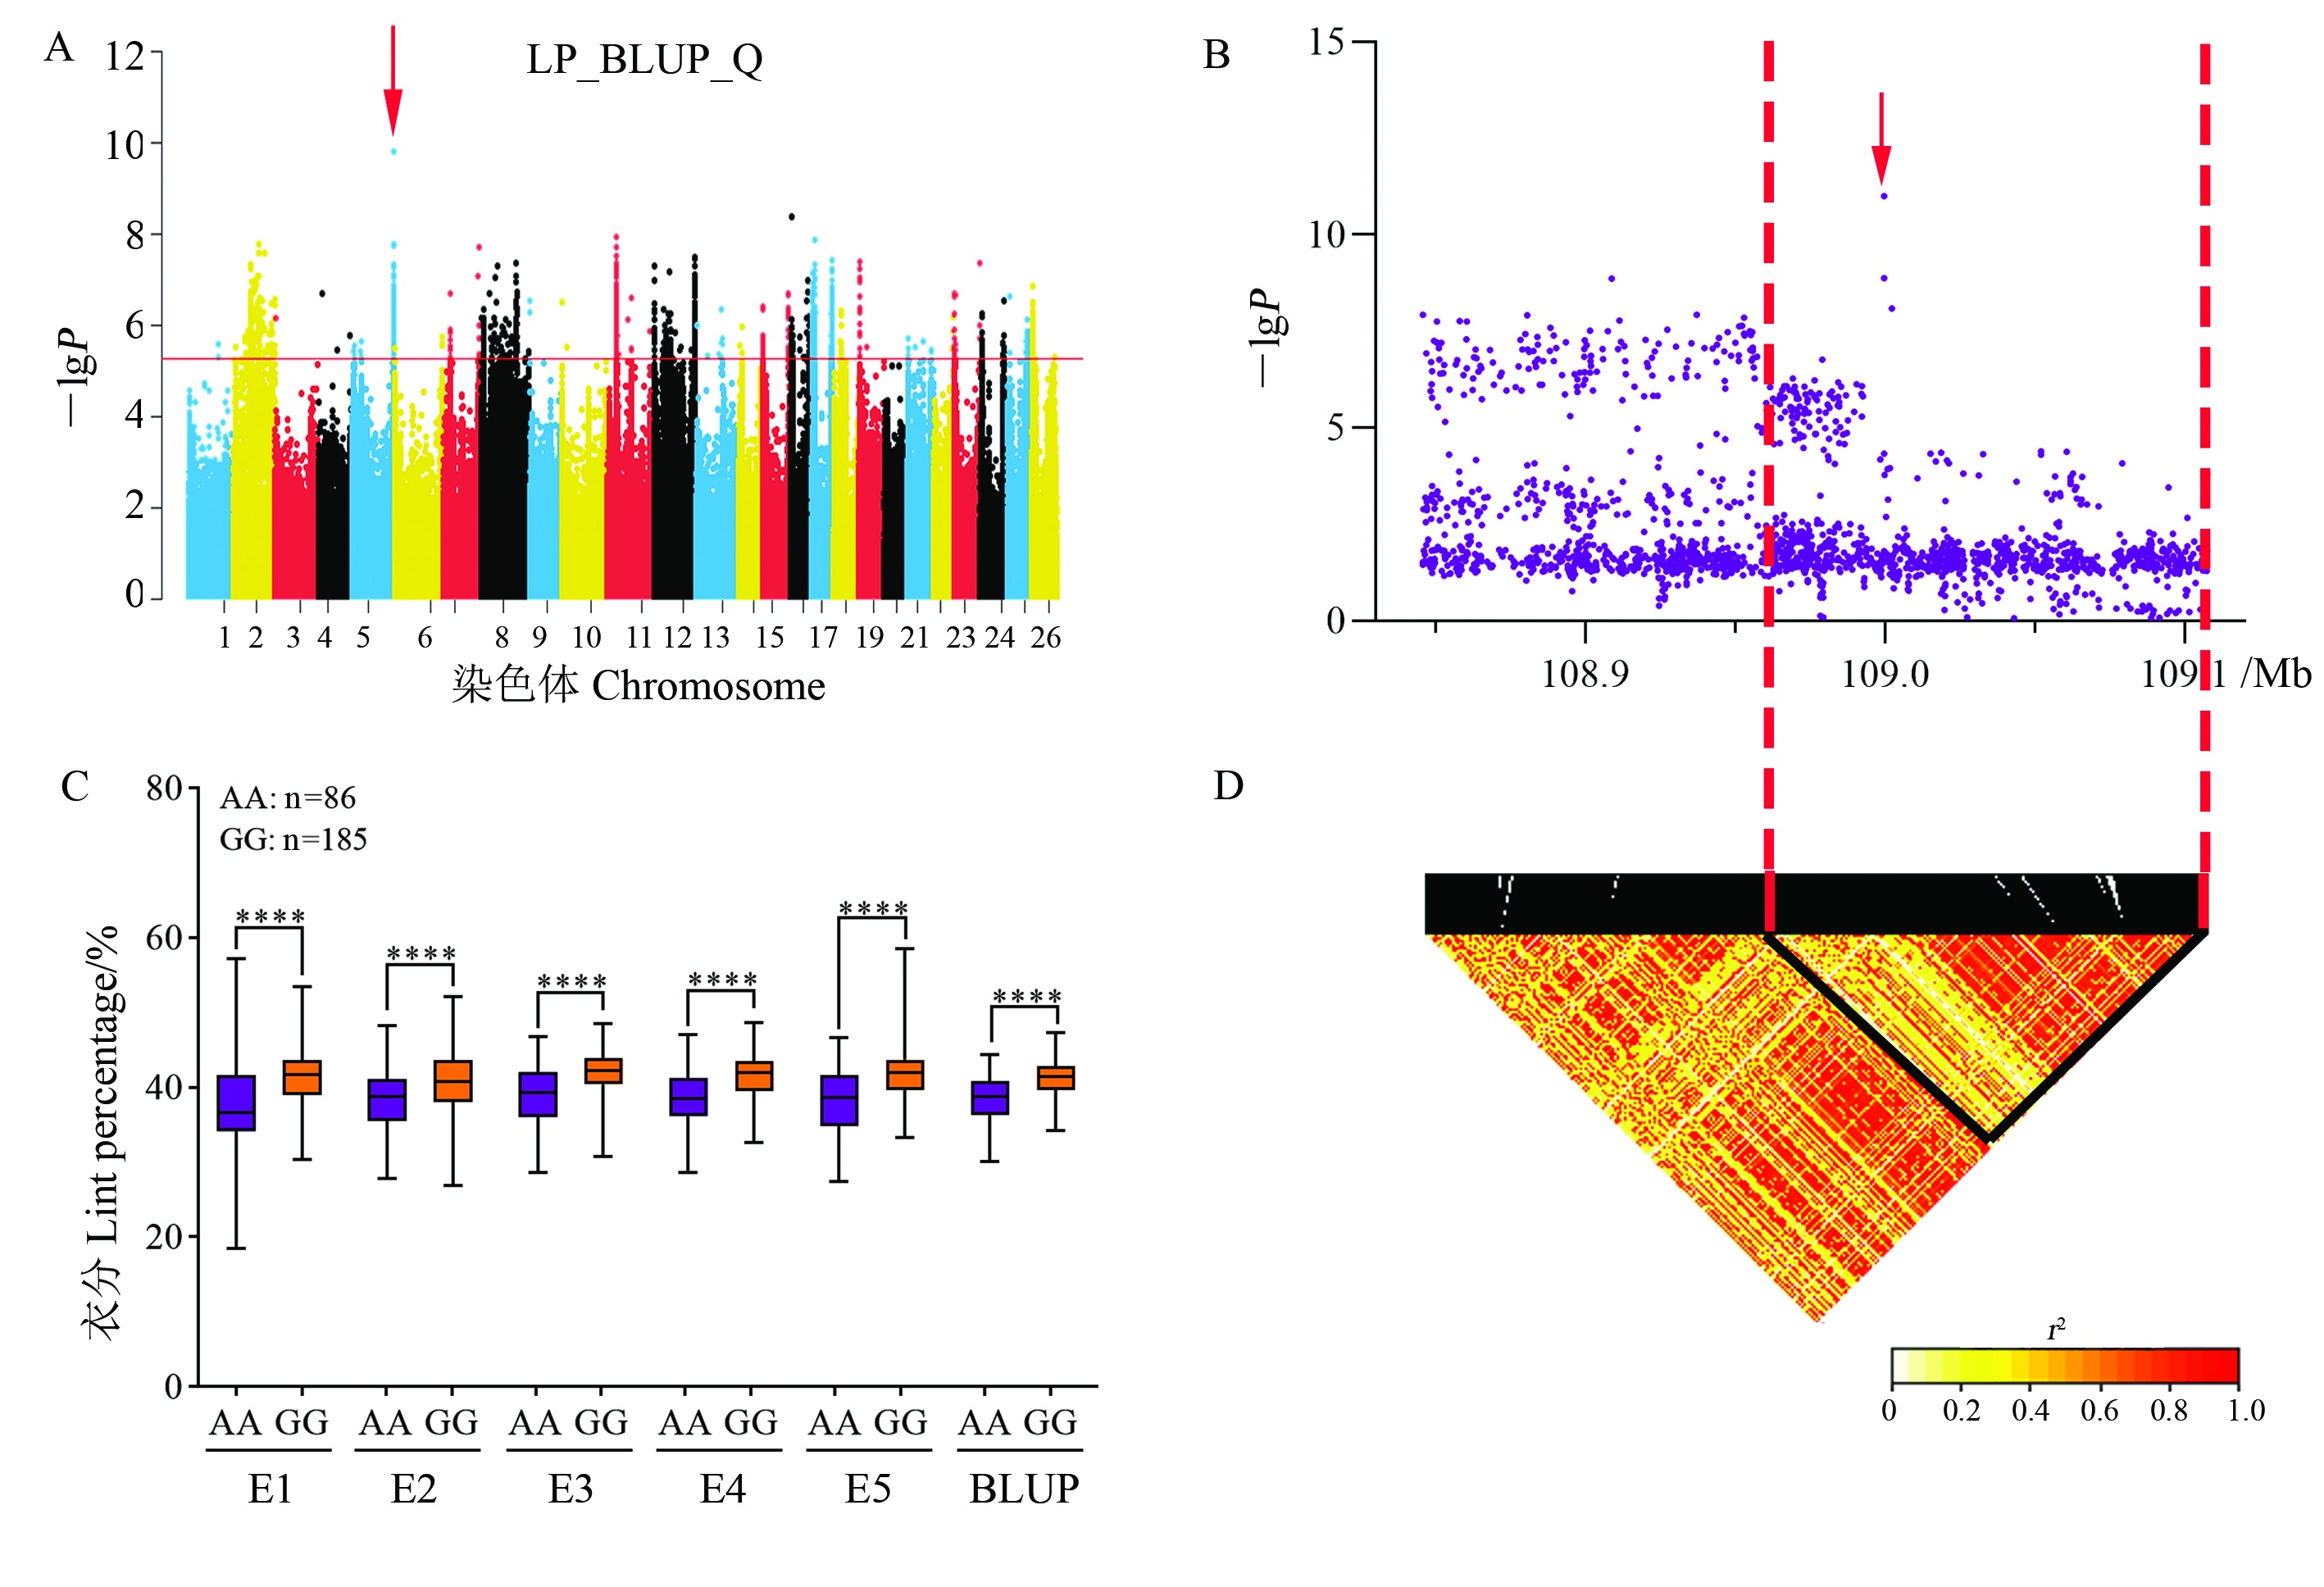
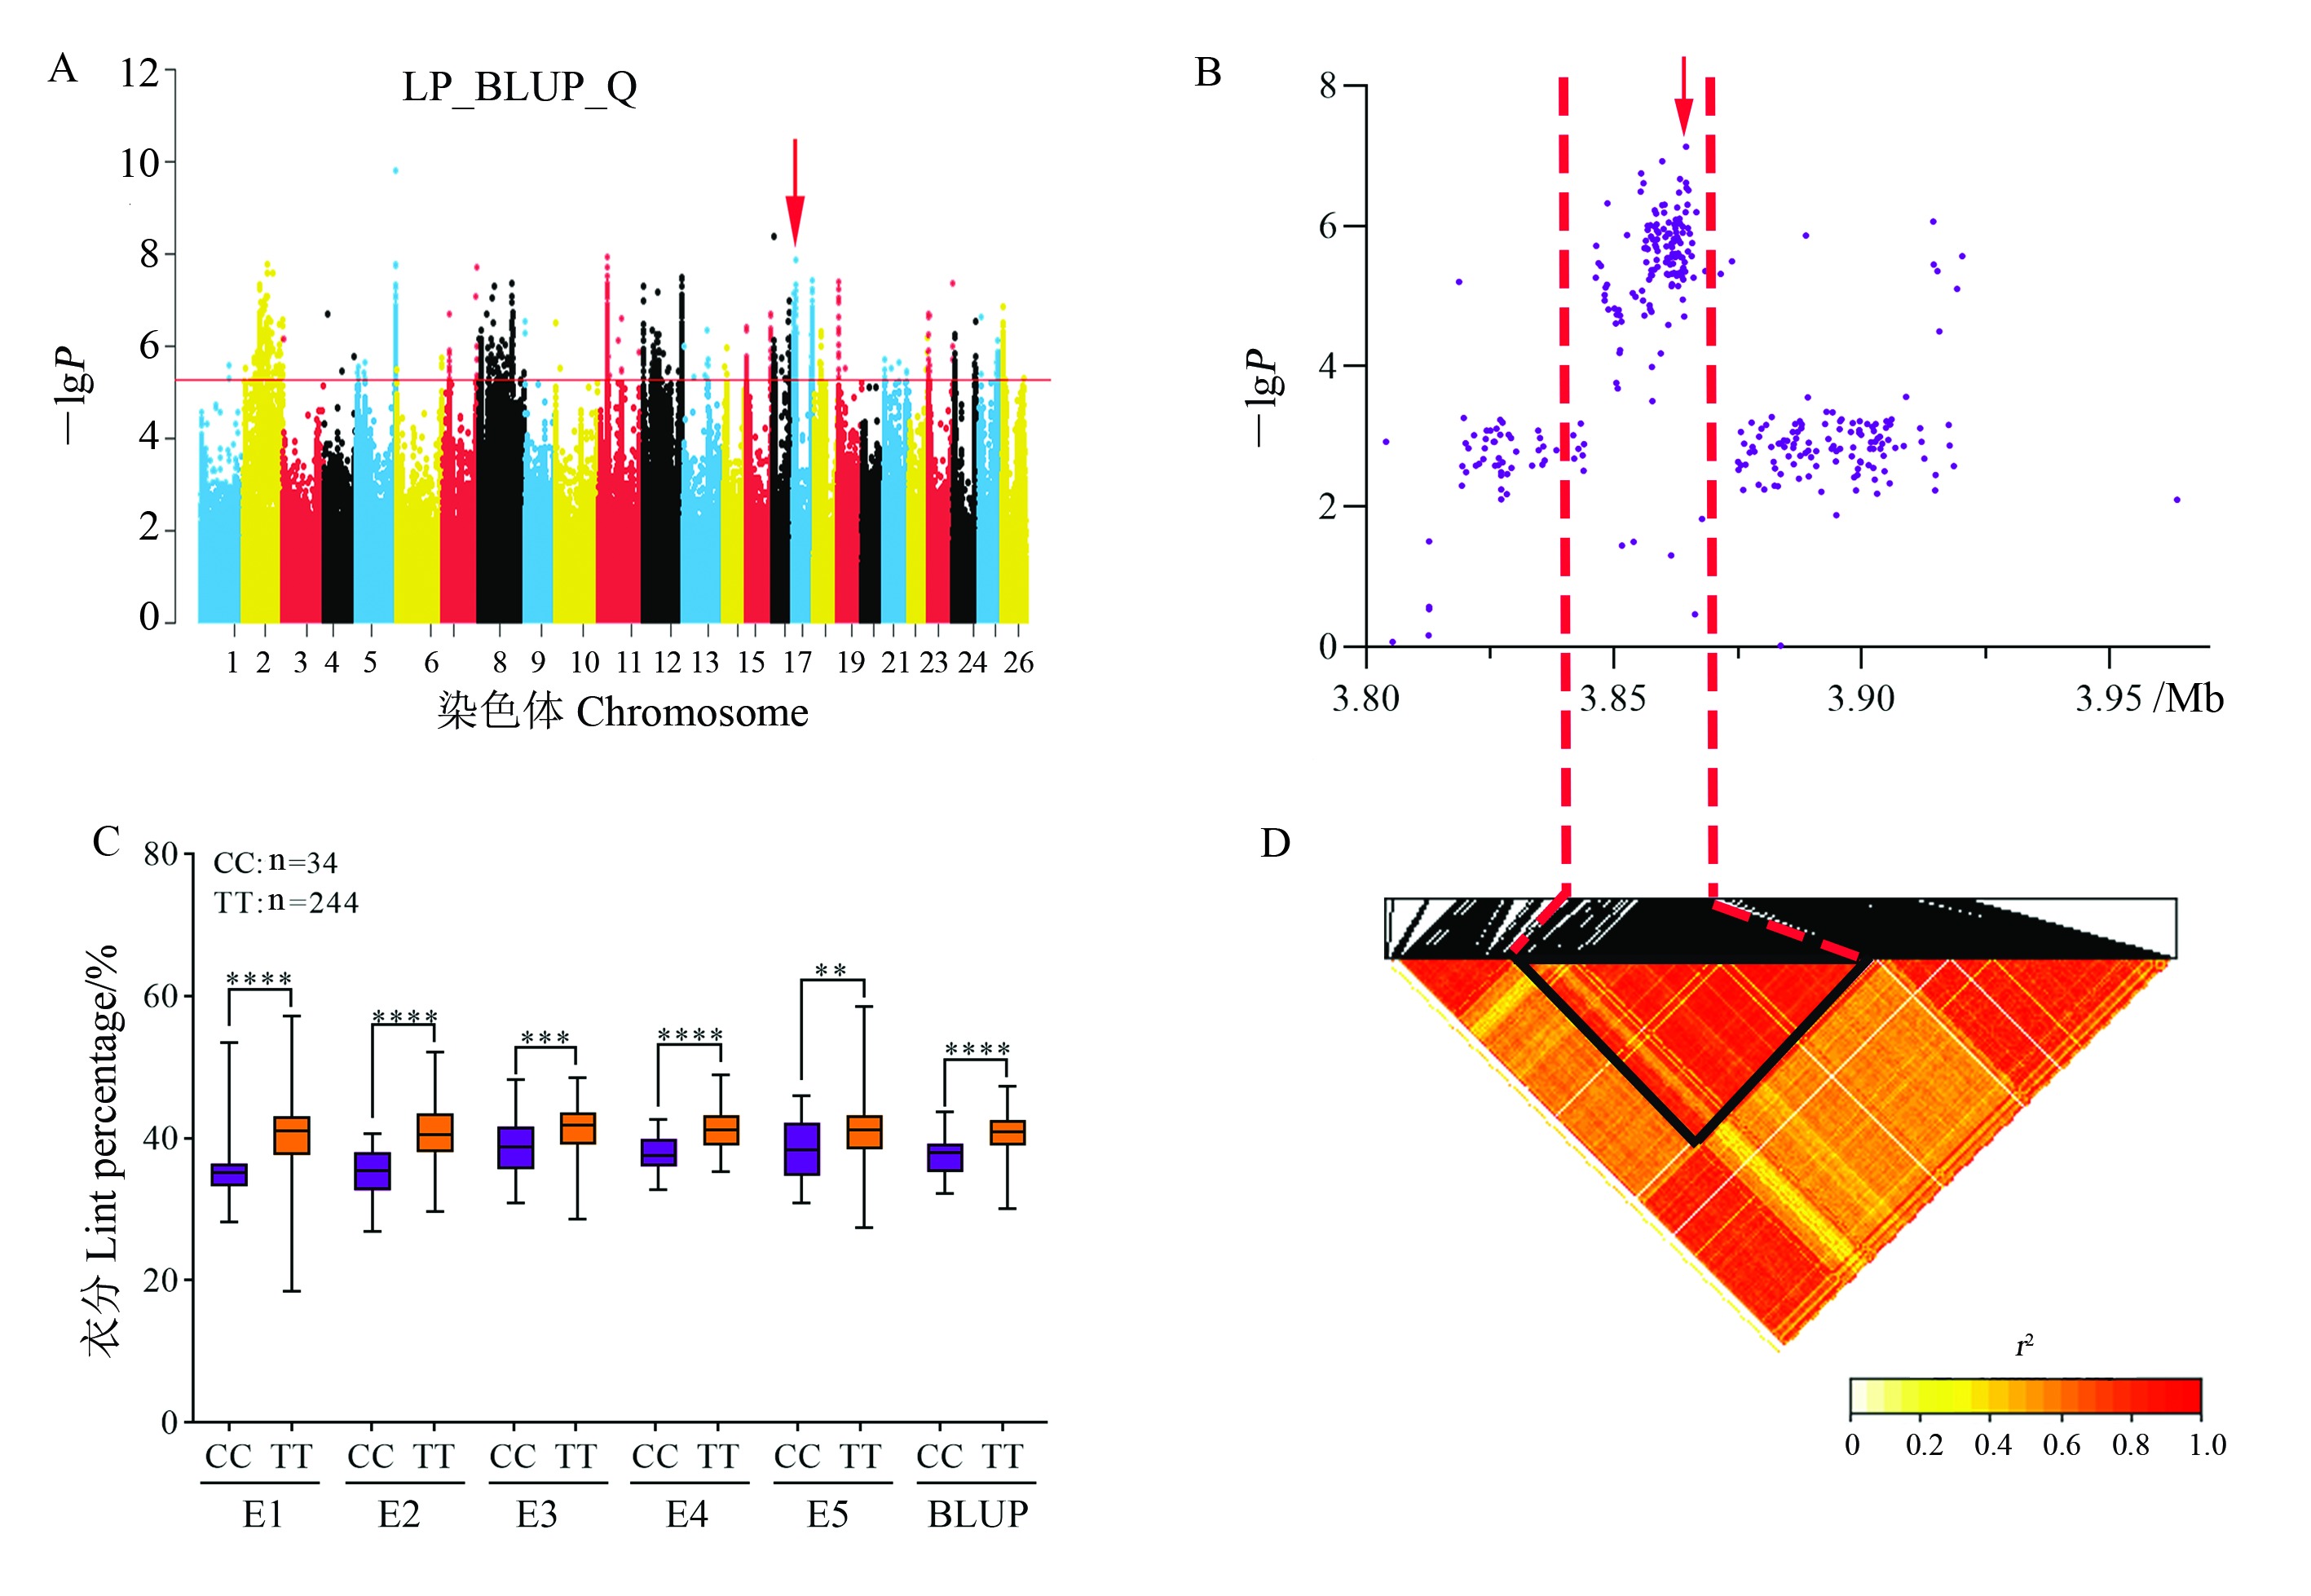
Fig. 2 Population structure, phylogeny, principal component analysis and linkage disequilibrium decay analysis of 300 upland cotton materials A: Optimal number of subgroups by cross-validation; B: Phylogenetic tree; C: Population structure analysis with K = 6; D: PCA analysis; E: Linkage disequilibrium decay.
Fig. 5 Analysis of the LP-related QTL qLP-Gh12.43 on chromosome A12 A: Manhattan plot of association mapping of LP based on E5 in GLM (P) model. B: Localized Manhattan plot around the peak region on chromosome A12, with red arrows indicating snp1691332 in qLP-Gh12.43. C: Boxplot of LP based on the snp1691332 genotype; **** represent significance at the 0.000 1 probability level. D: LD heat map of SNP in the 106.57-106.82 Mb interval.
Fig. 6 Analysis of the LP-related QTL qLP-Gh17.2 on chromosome D04 A: Manhattan plot of association mapping of LP based on BLUP value in GLM (Q) model; B: Localized Manhattan plot around the peak region on chromosome D04, with red arrows indicating snp2180718 in qLP-Gh12.43; C: Boxplot of LP based on the snp2180718 genotype; **, ***, and **** represent significant difference at the 0.01, 0.001, and 0.000 1 probability levels, respectively. D: LD heat map of SNP in the 3.80-3.96 Mb interval.
Fig. 7 Analysis of the BW-related QTL qBW-Gh7.5 on chromosome A07 A: Manhattan plot of association mapping of BW based on BLUP value in GLM (P) model. B: Localized Manhattan plot around the peak region on chromosome A07, with red arrows indicating snp852852 in qBW-Gh7.5. C: Boxplot of BW based on the snp852852 genotype; ** represents significant difference at the 0.01 probability level. D: LD heat map of SNP in the 90.83 - 91.18 Mb interval.
Fig. 8 Analysis of the BW-related QTL qBW-Gh19.5 on chromosome D06 A: Manhattan plot of association mapping of BW in E5 and GLM (Q) model. B: Localized Manhattan plot around the peak region on chromosome D06, with red arrows indicating snp2428027 in qBW-Gh19.5. C: Boxplot of BW based on the snp24280272 genotype; * represents significant difference at the 0.01 probability level. D: LD heat map of SNP in the 64.22 - 64.56 Mb interval.