| 性状 Trait | 环境 Environment | 最小值 Minimum | 最大值 Maximum | 平均 Mean | SD | 偏度 Kurtosis | 峰度 Skewness | CV/% | H2/% |
|---|---|---|---|---|---|---|---|---|---|
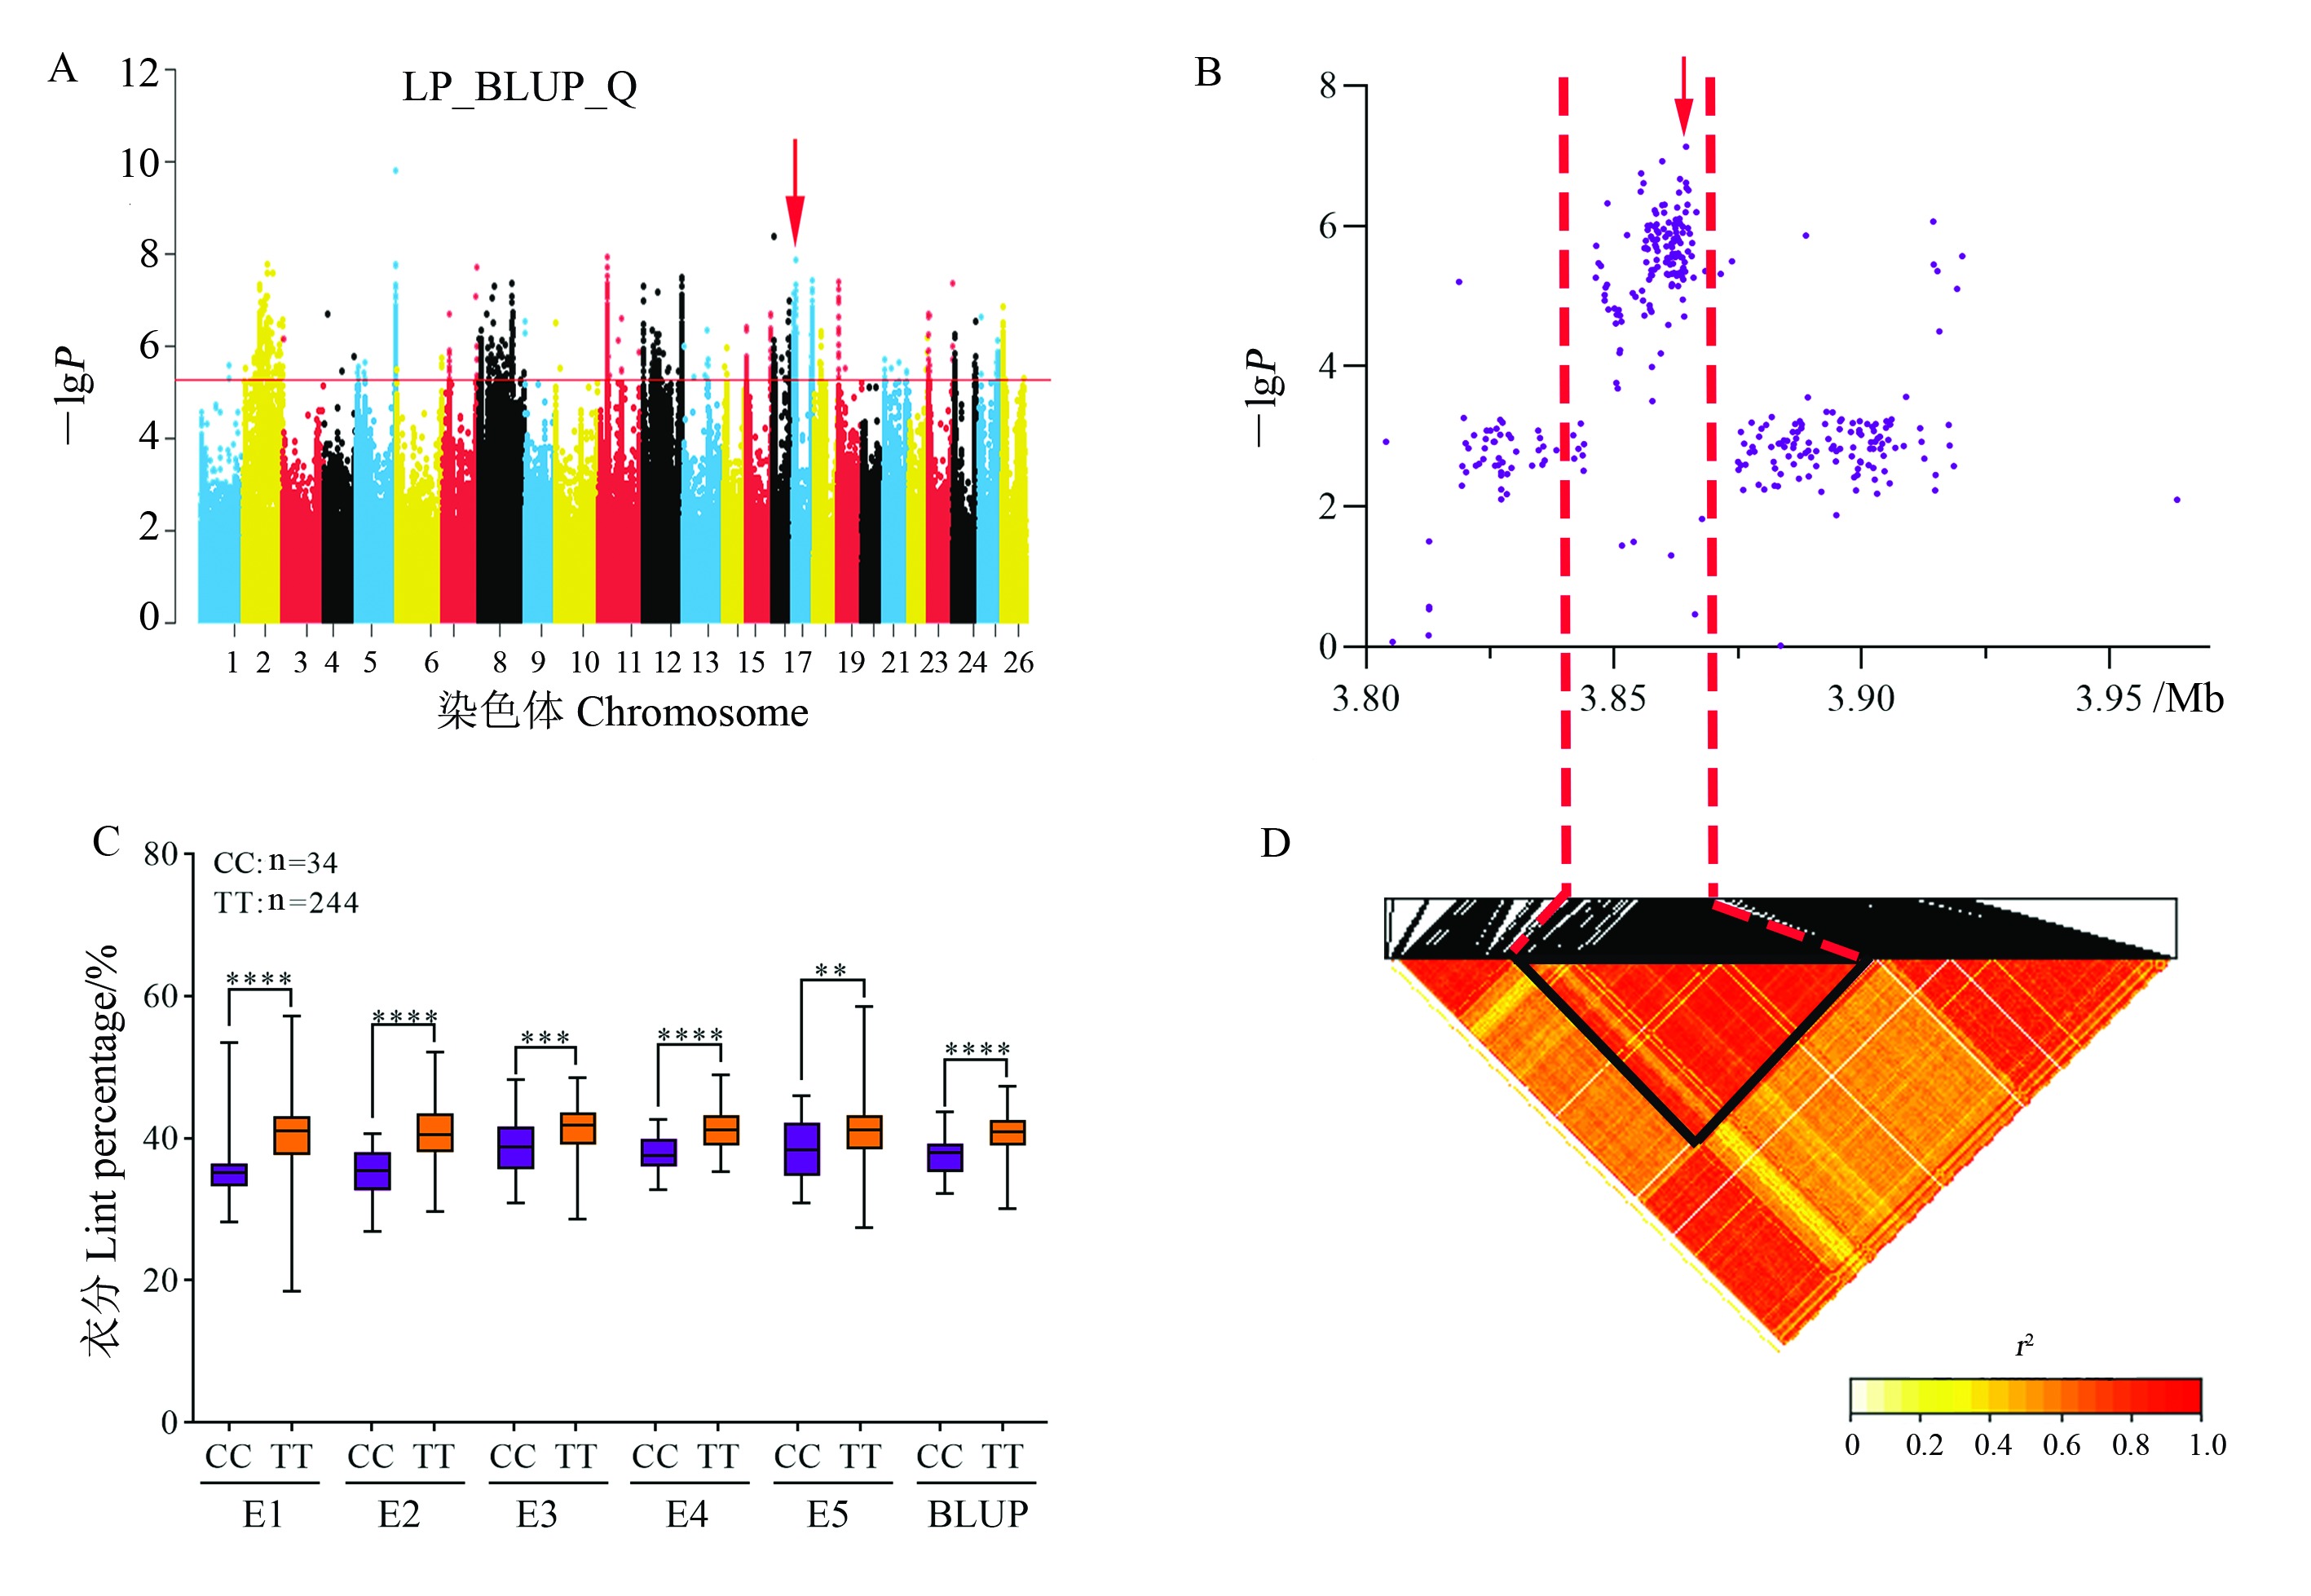
| LP/% | E1 | 18.45 | 57.16 | 39.82 | 4.70 | -0.47 | 1.36 | 11.82 | 92.81 |
| E2 | 26.82 | 52.15 | 40.02 | 4.11 | -0.35 | 0.38 | 10.26 | ||
| E3 | 28.55 | 48.54 | 40.98 | 3.60 | -0.65 | 0.29 | 8.80 | ||
| E4 | 28.53 | 48.97 | 40.69 | 3.48 | -0.42 | 0.10 | 8.55 | ||
| E5 | 27.46 | 58.54 | 40.55 | 3.98 | -0.24 | 1.22 | 9.82 | ||
| BLUP | 30.05 | 47.33 | 40.34 | 2.88 | -0.60 | 0.44 | 7.14 | ||
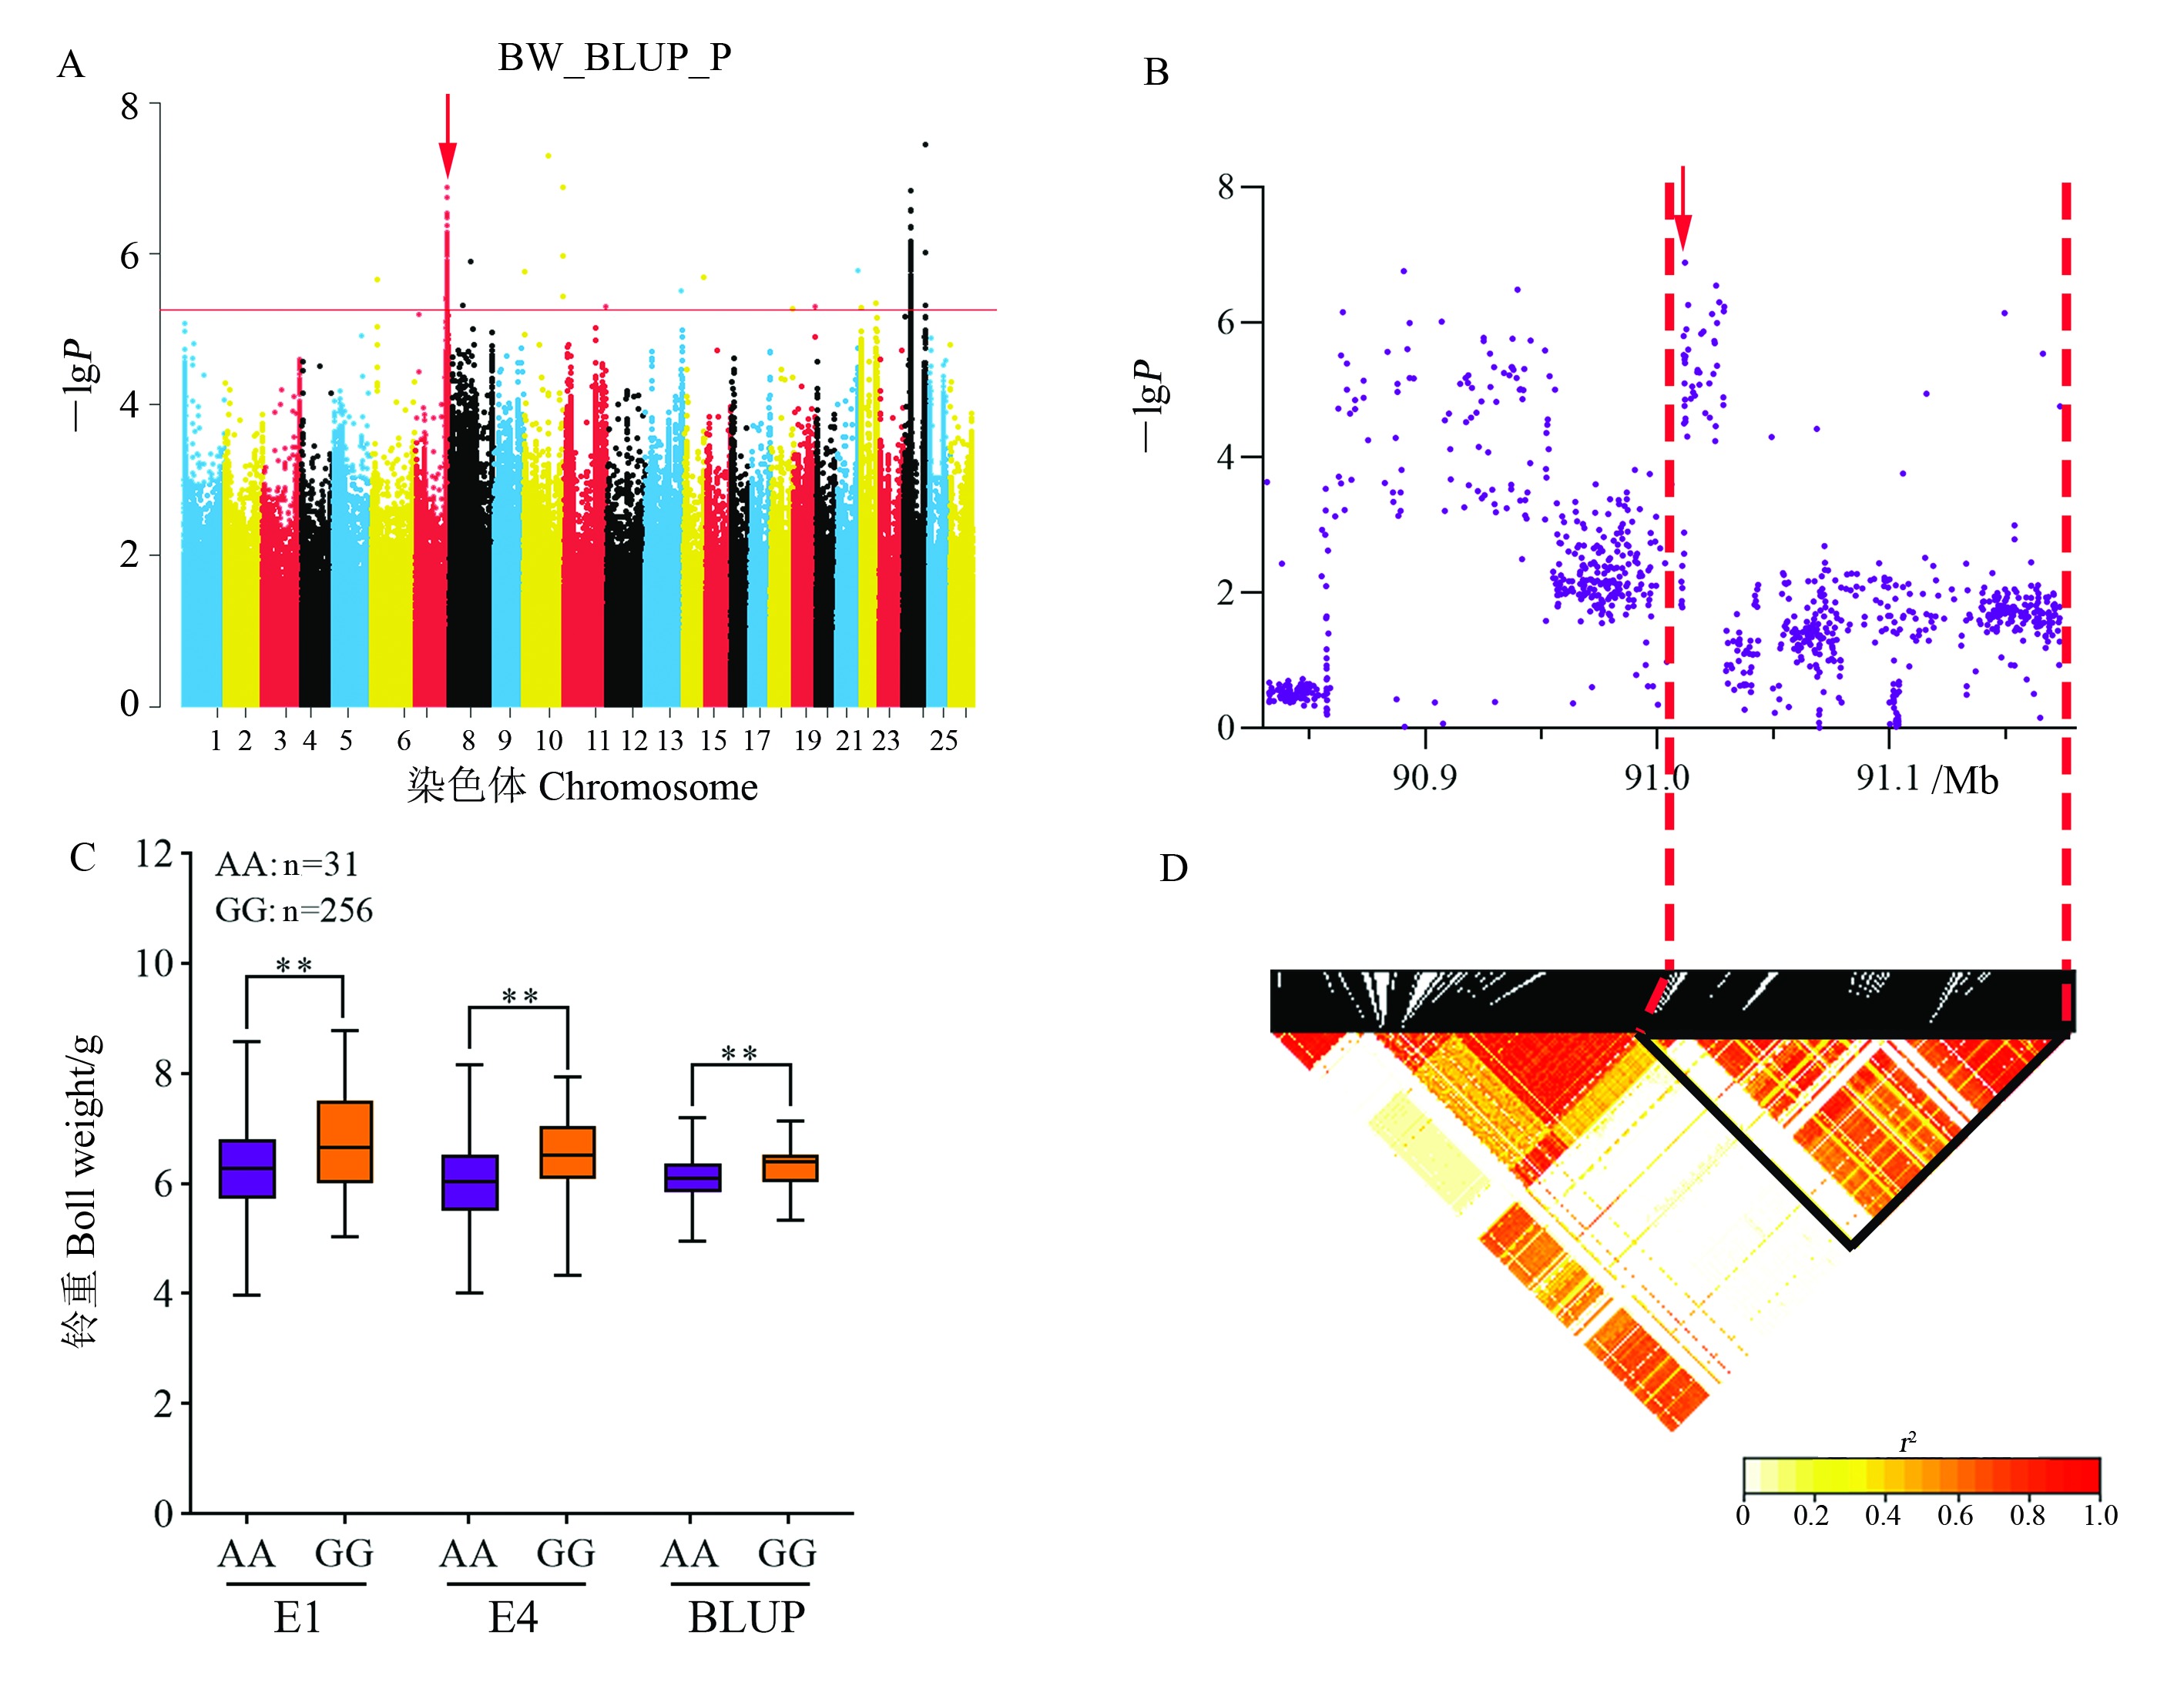
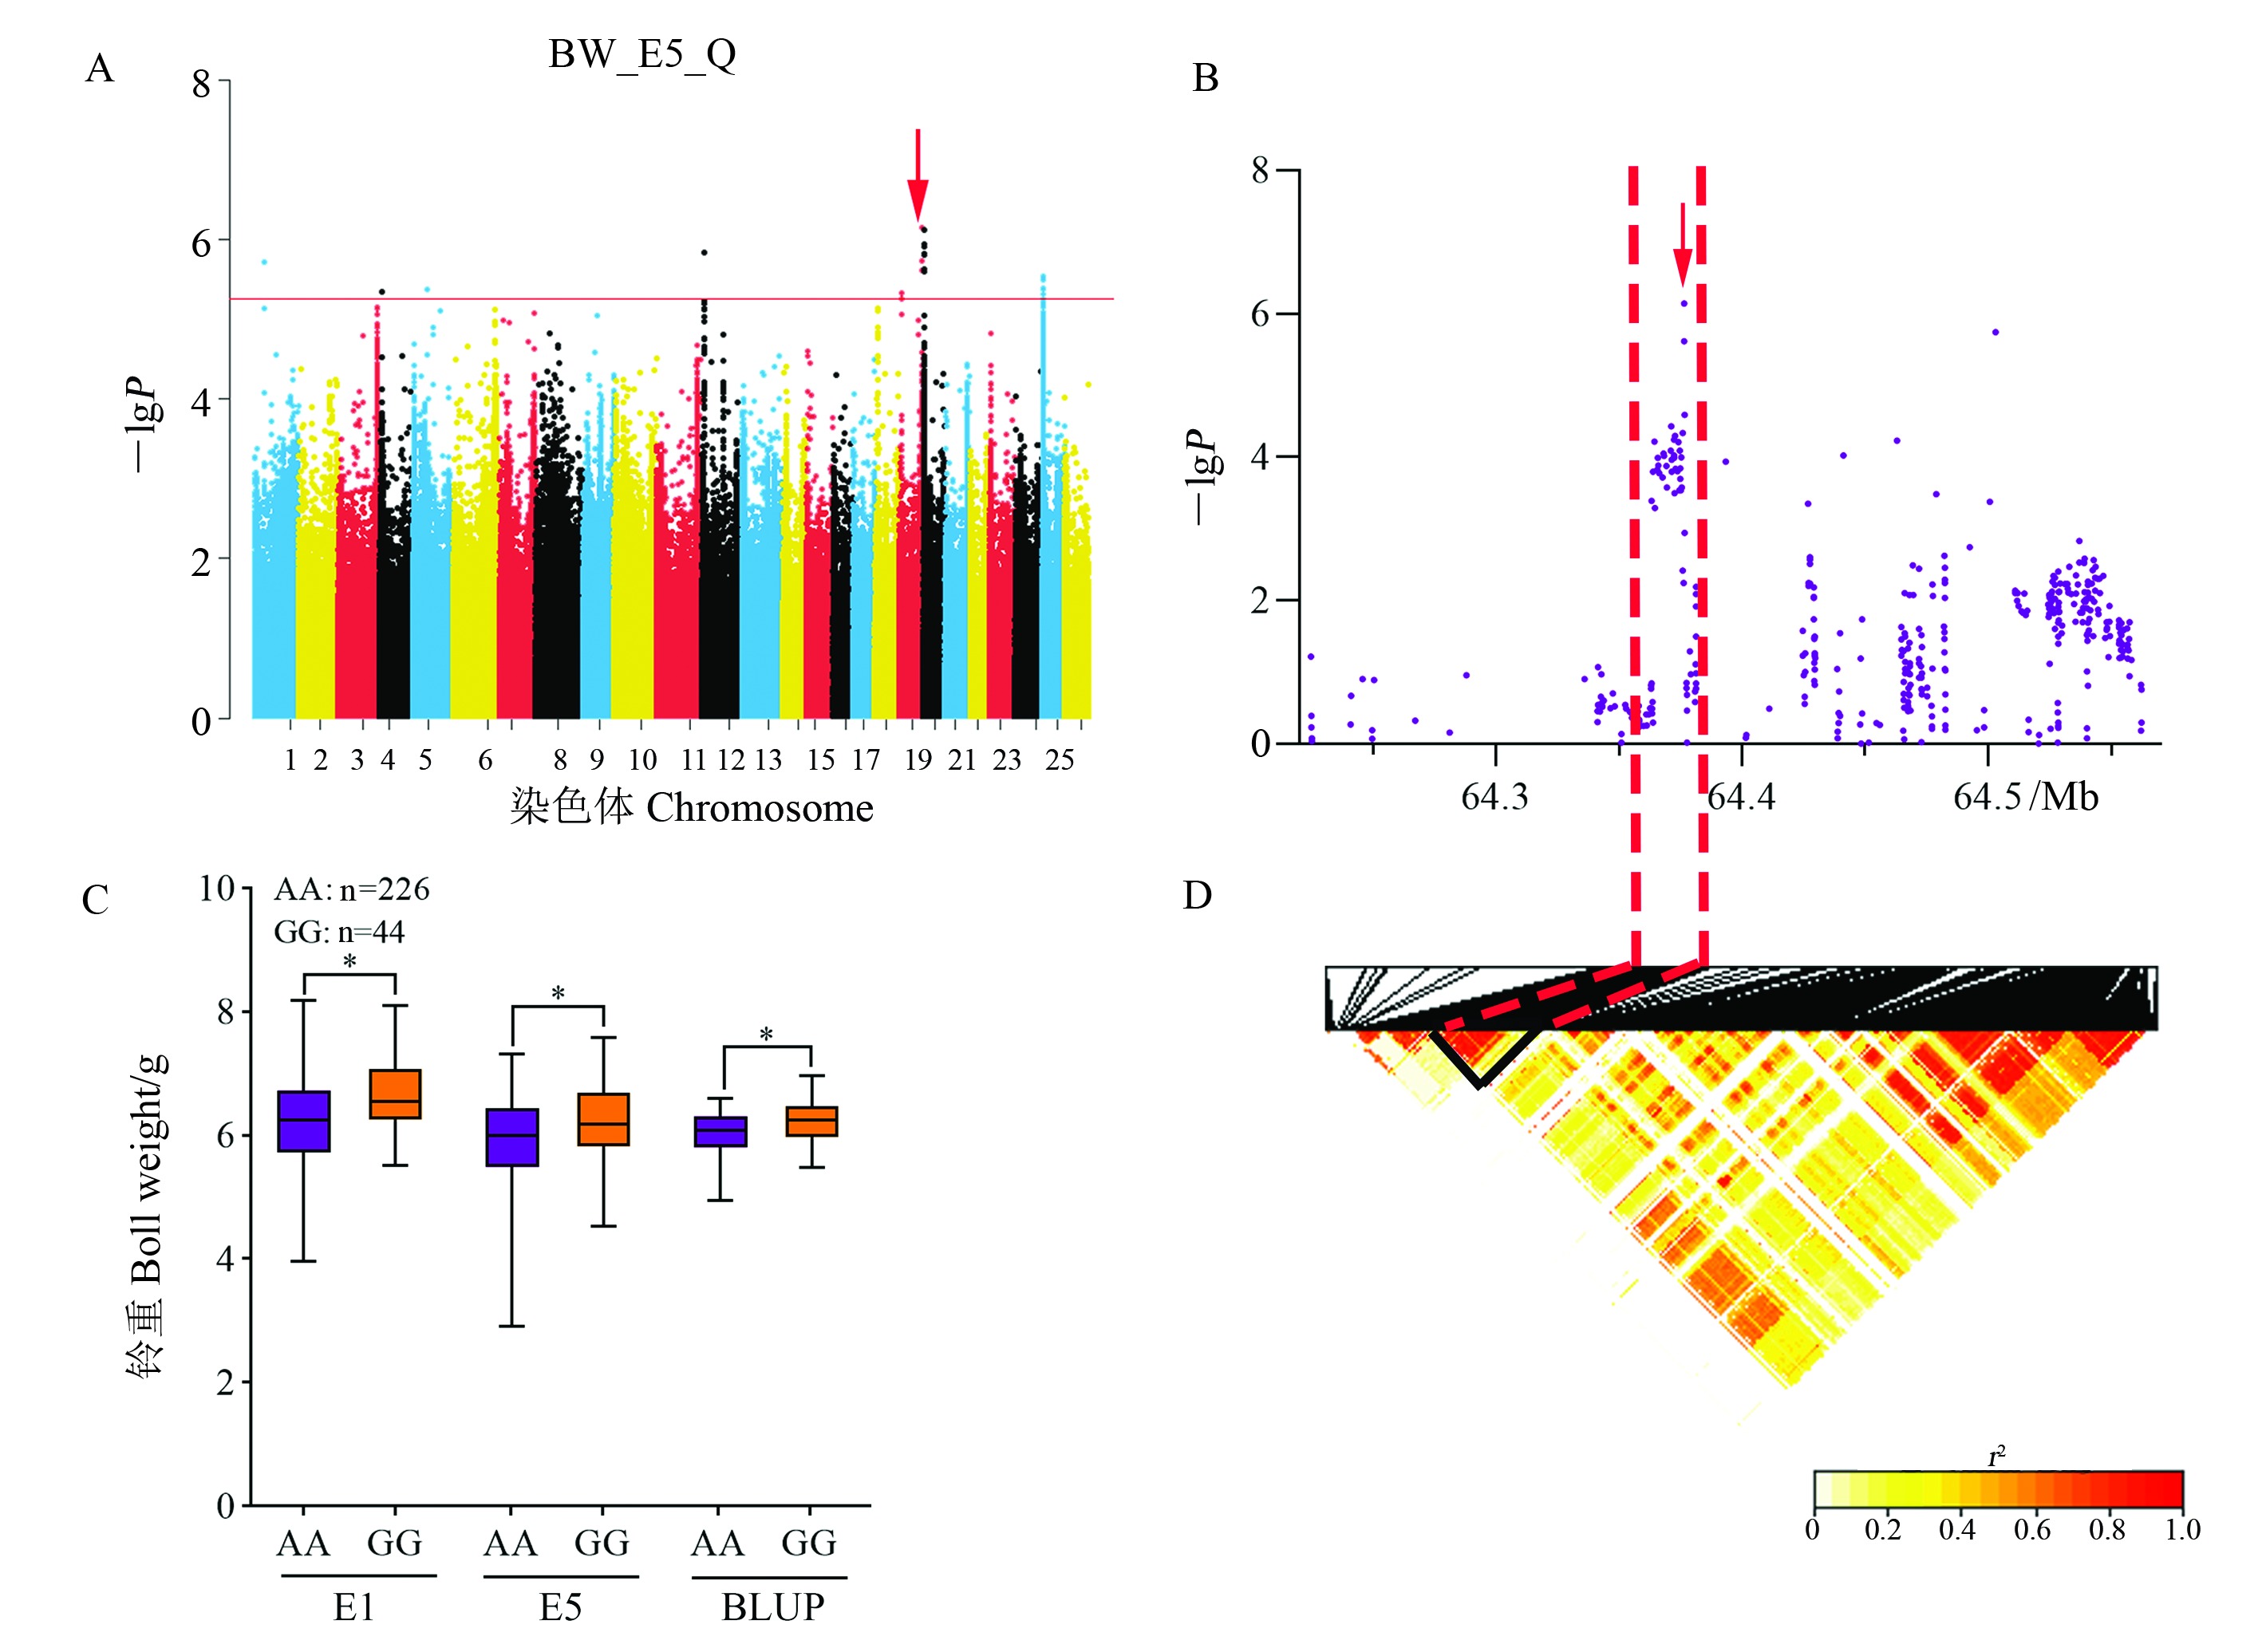
| BW/g | E1 | 3.96 | 8.78 | 6.33 | 0.83 | 0.05 | 0.22 | 13.04 | 86.67 |
| E2 | 3.47 | 8.58 | 6.04 | 0.89 | 0.14 | 0.22 | 14.79 | ||
| E3 | 3.37 | 8.32 | 6.10 | 0.80 | -0.13 | 0.14 | 13.15 | ||
| E4 | 4.01 | 8.16 | 6.11 | 0.74 | 0.07 | -0.22 | 12.08 | ||
| E5 | 2.91 | 7.88 | 6.06 | 0.73 | -0.37 | 0.57 | 12.10 | ||
| BLUP | 4.95 | 7.20 | 6.13 | 0.40 | -0.20 | 0.13 | 6.60 |
Fig. 2 Population structure, phylogeny, principal component analysis and linkage disequilibrium decay analysis of 300 upland cotton materials A: Optimal number of subgroups by cross-validation; B: Phylogenetic tree; C: Population structure analysis with K = 6; D: PCA analysis; E: Linkage disequilibrium decay.
Fig. 4 Analysis of the LP-related QTL qLP-Gh5.18 on chromosome A05 A: Manhattan plot of association mapping of LP based on BLUP value in GLM (Q) model. Chromosomes 1 to 13 represent chromosomes A01 to A13, and 14 to 26 represent chromosomes D01 to D13. B: Localized Manhattan plot around the peak region on chromosome A05, with red arrows indicating snp497745. C: Boxplot of LP based on the snp497745 genotype. Significance analysis was performed; **** represent significance at the 0.000 1 probability level. D: LD heat map of SNP in the 108.85-109.11 Mb interval.
Fig. 5 Analysis of the LP-related QTL qLP-Gh12.43 on chromosome A12 A: Manhattan plot of association mapping of LP based on E5 in GLM (P) model. B: Localized Manhattan plot around the peak region on chromosome A12, with red arrows indicating snp1691332 in qLP-Gh12.43. C: Boxplot of LP based on the snp1691332 genotype; **** represent significance at the 0.000 1 probability level. D: LD heat map of SNP in the 106.57-106.82 Mb interval.
Fig. 6 Analysis of the LP-related QTL qLP-Gh17.2 on chromosome D04 A: Manhattan plot of association mapping of LP based on BLUP value in GLM (Q) model; B: Localized Manhattan plot around the peak region on chromosome D04, with red arrows indicating snp2180718 in qLP-Gh12.43; C: Boxplot of LP based on the snp2180718 genotype; **, ***, and **** represent significant difference at the 0.01, 0.001, and 0.000 1 probability levels, respectively. D: LD heat map of SNP in the 3.80-3.96 Mb interval.
Fig. 7 Analysis of the BW-related QTL qBW-Gh7.5 on chromosome A07 A: Manhattan plot of association mapping of BW based on BLUP value in GLM (P) model. B: Localized Manhattan plot around the peak region on chromosome A07, with red arrows indicating snp852852 in qBW-Gh7.5. C: Boxplot of BW based on the snp852852 genotype; ** represents significant difference at the 0.01 probability level. D: LD heat map of SNP in the 90.83 - 91.18 Mb interval.
Fig. 8 Analysis of the BW-related QTL qBW-Gh19.5 on chromosome D06 A: Manhattan plot of association mapping of BW in E5 and GLM (Q) model. B: Localized Manhattan plot around the peak region on chromosome D06, with red arrows indicating snp2428027 in qBW-Gh19.5. C: Boxplot of BW based on the snp24280272 genotype; * represents significant difference at the 0.01 probability level. D: LD heat map of SNP in the 64.22 - 64.56 Mb interval.