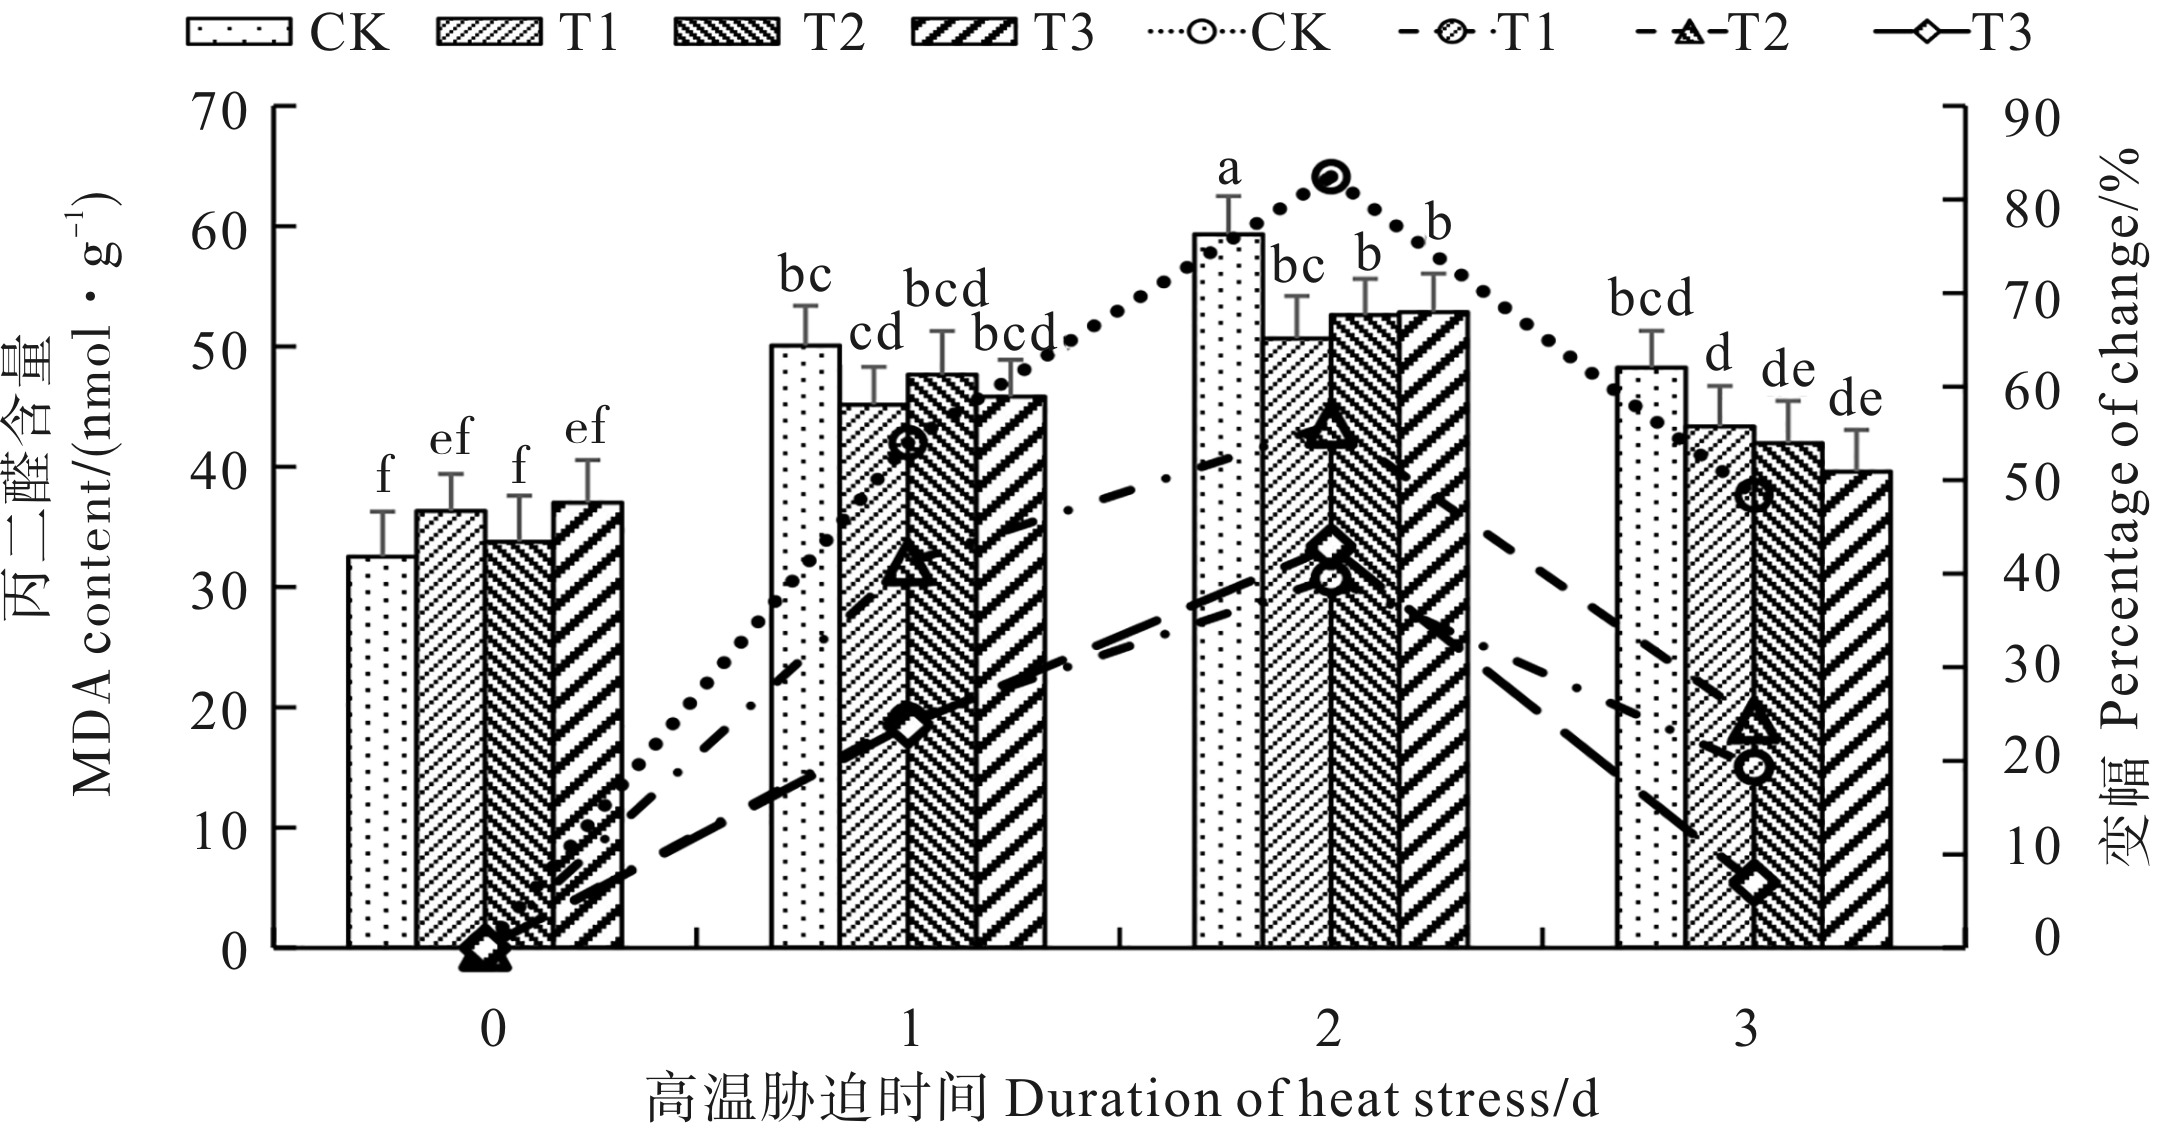
Fig. 2 Effects of spraying MeJA during flowering and boll-setting stage on photosynthetic parameters of cotton under heat stress The bar chart showed the value of photosynthetic parameters, and the line chart showed the change rate of photosynthetic parameters at each time point compared with that of 0 d. Different lowercase letters indicate significant difference (P < 0.05).
Other figure/table from this article